Why Sonia & Rahul Gandhi Are Not Very Good MPs
| HIGHLIGHTS * Bihar MPs have spent the least amount of funds allocated to them. * Prime Minister Manmohan Singh and Opposition Leader Sushma Swaraj have reported high utilisation of funds. * MPs spending more on education, less on health |
India’s Members of Parliament Local Area Development Scheme (MPLADS) is an interesting empowerment device for MPs to pour funds into developing their constituencies. While each MP gets Rs 5 crore a year, utilisation levels are not consistent and sometimes unusually low.
IndiaSpend’s Bhumish Khudkhudia finds that MPs from states like Bihar, the third most populous states, have undertaken the least expenditure on priority sector areas like education and public health. On the other hand, several individual MPs like Sushma Swaraj (BJP) and Sitaram Yechury (CPI-M ) have been the most agile in spending their allocated funds.
Interestingly, among the priority sector schemes selected, the maximum number of projects (73,380) are focussed on improving or creating drinking water facilities followed by education, sanitation & public health, irrigation and health & family welfare.
As on August 31, 2012, 1.5 million works have been recommended by MPs since the inception of the scheme in 1993. Nearly 90% of the projects have been completed at the national level out of the sanctioned projects totalling 1.2 million. At this time, Rs 26,237.2 crore has been released and an expenditure of Rs 23,255.3 crore incurred. So, the percentage of utilisation works out to 88.6%.
The funds released under MPLADS are 'non-lapsable’ i.e. funds not released in a particular year are carried forward to subsequent years, subject to eligibility. MPLADS projects can also be implemented in areas affected by natural calamities like floods, earthquake and drought.
The maximum amount that can be recommended by MPs for development work has gone up over the years as shown in the following table:
Table 1: Increasing Allocations
Year | Amount (in Rs.) |
1993-1994 | 5 lakh |
1994-1995 to 1997-1998 | 1 crore |
1998-99 to 2010-2011 | 2 crore |
2011 onwards | 5 crore |
While Lok Sabha (the lower house) members can recommend works for their respective constituencies, Rajya Sabha (the higher house) members can recommend works for implementation in one or more districts in the state of their election. Nominated members of Lok Sabha and Rajya Sabha can recommend works for execution anywhere in the country.
The Ministry of Statistics and Programme Implementation (MoSPI) is responsible for policy formulation, release of funds and monitoring the implementation of the scheme.
Generally, the District Collector, the District Magistrate or the Deputy Commissioner is the implementing authority for MPLADS.
Let us now look at the spending pattern of the top leaders.
Table 2: Spending Patterns of the Top Leaders
(All figures in Rs crore)
LOK SABHA MPs | ||||||
MP, his/her state, constituency | Amount available | Recommended by MP | Amount Sanctioned | Expense incurred | % Utilisation | Unspent Balance |
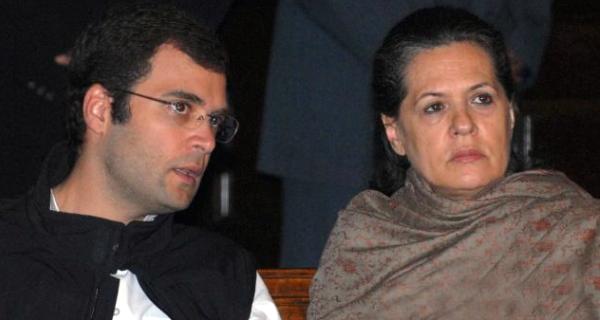
Sonia Gandhi, Uttar Pradesh, Rae Bareli | 9.15 | 7.40 | 5.20 | 4.31 | 47.56% | 4.84 |
Sushma Swaraj, Madhya Pradesh, Vidisha | 11.75 | 12.25 | 11.25 | 10.52 | 91.20% | 1.23 |
LK Advani, Gujarat, Gandhinagar | 6.65 | 11.58 | 7.01 | 1.71 | 26% | 4.94 |
Rahul Gandhi, Uttar Pradesh, Amethi | 6.60 | 3.10 | 3.10 | 2.32 | 35.35% | 4.28 |
Baijayant Panda, Odisha, Kendrapara | 6.78 | 12.63 | 6.31 | 3.05 | 46.92% | 3.73 |
RAJYA SABHA MPs | ||||||
Dr. Manmohan Singh, Assam, Kamrup Metropolitan | 38.31 | 35.28 | 35.28 | 33.66 | 89.64% | 4.65 |
Arun Jaitley, Gujarat, Kheda | 21.98 | 25.20 | 25.55 | 18.09 | 86.14% | 3.89 |
Ravi Shankar Prasad, Bihar, Patna | 25.61 | 30.89 | 22.18 | 21.94 | 89.55% | 3.67 |
Sitaram Yechury, West Bengal, Kolkata | 17.17 | 14.68 | 14.58 | 14.58 | 91.13% | 2.59 |
Ashok Ganguly, Nominated Member, Mumbai City | 5.52 | 1.71 | 1.71 | 1.41 | 25.64% | 4.11 |
( Source: https://mplads.nic.in/) (All Lok Sabha MPs have been entitled to an amount of Rs 14 crore for the current 15th Lok Sabha since the year 2009)
Rajya Sabha MPs who have been entitled funds under MPLADS are: Dr. Manmohan Singh (Rs 40.05 crore); Arun Jaitley (Rs 32 crore); Ravi Shankar Prasad (Rs 32 crore), Sitaram Yechury (Rs 21 crore) and Ashok Ganguly (Rs 13 crore). Their amounts are high because their tenures have been running for much longer than the Lok Sabha MPs.
BJP leader LK Advani incurred the least amount of expenditure of Rs. 1.71 crore out of the released amount of Rs 6.65 crore. Sushma Swaraj, who is currently the Leader of Opposition in the Lok Sabha, incurred the highest amount of expenditure of Rs 10.52 crore and the highest percentage of utilisation rate of 91.20%. The highest amount of Rs 12.63 crore was recommended by BJD’s Baijayant Panda. Congress MP Rahul Gandhi could incur an expenditure of only Rs 2.32 crore while UPA chairperson Sonia Gandhi incurred an expenditure of Rs 4.31 crore.
Prime Minister Dr. Manmohan Singh recommended the highest amount of Rs 35 crore and had an utilisation rate of over 89%. CPM leader Sitaram Yechury utilised 91.13% (which is the highest among the five Rajya Sabha MPs) of the amount released.
Priority Sector Focus
We looked at five priority sector reports for inter-state comparisons of MPLAD spending of the current Lok Sabha (since 2009) members and Rajya Sabha MPs. The sectors are:
1) Drinking water facilities.
2) Education.
3) Health and family welfare.
4) Sanitation and public health; and
5) Irrigation.
Ten states have been selected on the basis of population and representations in the Lok Sabha and the Rajya Sabha.
Table 3: Top 10 States
States | Number of Constituencies | Lok Sabha | Rajya Sabha |
Uttar Pradesh | 111 | 80 | 31 |
Maharashtra | 67 | 48 | 19 |
Bihar | 56 | 40 | 16 |
West Bengal | 58 | 42 | 16 |
Andhra Pradesh | 60 | 42 | 18 |
Madhya Pradesh | 40 | 29 | 11 |
Tamil Nadu | 57 | 39 | 18 |
Rajasthan | 35 | 25 | 10 |
Karnataka | 40 | 28 | 12 |
Gujarat | 37 | 26 | 11 |
Drinking water facilities
MPLAD funds were spent on water tankers, water tanks, desilting of ponds, piped drinking water supply, tube wells, hand pumps and other works for providing drinking water facilities.
Table 4: AP Tops The List
Name | Total sanctioned cost of works (In Rs. crore) | Total number of works |
Uttar Pradesh | 147.06 | 6,222 |
Maharashtra | 96.07 | 6,792 |
Bihar | 4.72 | 771 |
West Bengal | 105.04 | 8,340 |
Andhra Pradesh | 179.79 | 18,318 |
Madhya Pradesh | 63.88 | 7,406 |
Tamil Nadu | 55.84 | 2,569 |
Rajasthan | 84.19 | 12,791 |
Karnataka | 15.30 | 999 |
Gujarat | 60.34 | 9,622 |
TOTAL | 812.22 | 73,830 |
( Source: https://mplads.nic.in/)
MPs from Andhra Pradesh recommended projects worth Rs 179 crore for more than 18,000 projects followed by Uttar Pradesh where MPs spent Rs 147 crore. Bihar and Karnataka are the states with low sanctioned funds of Rs 4.72 crore and Rs. 15.30 crore, respectively.
Education
Funds were spent on building government educational institutions, government-aided and unaided educational institutions, computers for educational institutions and other projects.
Table 5: Bengal MPs Spent The Most
Name | Total sanctioned cost of work (In Rs. crore) | Total number of works |
Uttar Pradesh | 314.63 | 12,345 |
Maharashtra | 142.50 | 6,001 |
Bihar | 15.78 | 513 |
West Bengal | 482.13 | 22,753 |
Andhra Pradesh | 140.44 | 4,332 |
Madhya Pradesh | 39.20 | 2,085 |
Tamil Nadu | 143.53 | 3,641 |
Rajasthan | 96.92 | 5,571 |
Karnataka | 53.69 | 2,335 |
Gujarat | 65.07 | 3,739 |
TOTAL | 1,493.88 | 63,315 |
( Source: https://mplads.nic.in/)
West Bengal, with its literacy rate of 77%, saw MPs sanction Rs 482 crore for spending on 22,753 works. While Uttar Pradesh MPs sanctioned Rs 314 crore for 12,345 works, Bihar, which has the lowest literacy rate of 64%, also had the lowest sanctioned cost as well the number of projects. What is noticeable is that Maharashtra with the highest literacy rate of 83% created 6,001 works as against Tamil Nadu (80% literacy rate) with 3,641 works with almost similar funds (Rs 143 crore).
Health and family welfare
Funds have been allocated for ambulances, mobile dispensaries, crèches and anganwadis, procurement of hospital equipment for government hospitals, building hospitals and other health and family welfare projects.
Table 6: Bihar MPs Spent The Least
Name | Total sanctioned cost (In Rs crore) | Total number of works |
Uttar Pradesh | 10.72 | 190 |
Maharashtra | 24.25 | 501 |
Bihar | 4.43 | 62 |
West Bengal | 106.84 | 1,849 |
Andhra Pradesh | 22.34 | 561 |
Madhya Pradesh | 8.53 | 271 |
Tamil Nadu | 12.23 | 305 |
Rajasthan | 19.76 | 489 |
Karnataka | 5.77 | 283 |
Gujarat | 13.03 | 441 |
TOTAL | 227.88 | 4,952 |
( Source: https://mplads.nic.in/)
West Bengal sanctioned Rs 106 crore for completing 1,849 works. Gujarat has seen allocation of only Rs 13 crore for the health and family welfare sector. Bihar and Karnataka have seen low spending of only Rs 4 crore and Rs 6 crore, respectively, till now.
Sanitation and public health
Table 7: Maharashtra far ahead
Name | Total sanctioned cost (In Rs crore) | Total number of works |
Uttar Pradesh | 30.38 | 1,164 |
Maharashtra | 181.93 | 6,128 |
Bihar | 3.67 | 201 |
West Bengal | 42.95 | 1,717 |
Andhra Pradesh | 49.25 | 2,931 |
Madhya Pradesh | 7.80 | 651 |
Tamil Nadu | 28.59 | 1,331 |
Rajasthan | 5.41 | 351 |
Karnataka | 8.81 | 894 |
Gujarat | 14.90 | 1,402 |
TOTAL | 373.70 | 16,770 |
( Source: https://mplads.nic.in/)
By creating more than 6,000 works and spending Rs 182 crore, Maharashtra is ahead of the rest of the states while Bihar spent the least amount of Rs 3.66 crore.
Andhra Pradesh created 2,931 works by sanctioning Rs 49.25 crore while West Bengal created 1,717 works by utilising the sanctioned amount of Rs 42.95 crore.
Irrigation
MPLAD funds were allocated for public water table recharging facilities, public lift irrigation projects, construction of irrigation embankments, construction of public irrigation facilities and other public irrigation projects.
Table 8: UP, Rajasthan Miss Action
Name | Total sanctioned cost (in Rs. crore) | Total number of works |
Uttar Pradesh | 15.71 | 435 |
Maharashtra | 24.87 | 610 |
Bihar | 1.40 | 71 |
West Bengal | 18.42 | 850 |
Andhra Pradesh | 64.12 | 2,942 |
Madhya Pradesh | 22.23 | 603 |
Tamil Nadu | 52.23 | 1,242 |
Rajasthan | 5.08 | 261 |
Karnataka | 7.04 | 492 |
Gujarat | 12.86 | 696 |
TOTAL | 223.97 | 8,202 |
( Source: https://mplads.nic.in/)
Among the 10 states, Andhra Pradesh, with its total irrigated areas of 6.74 million hectares, saw the highest sanctioned amount of Rs 64.12 crore for 2,942 works followed by Tamil Nadu with its total irrigated area of 3.39 million hectares and sanctioned amount of Rs 52 crore.
While Uttar Pradesh has the largest total irrigated area in India with 19.5 million hectares, MPs have spent only Rs 15.71 crore for related projects. Rajasthan, which has the second largest irrigated area of 7.9 million hectares, saw sanctions of only Rs 5 crore.
While the spending of funds, like any other government scheme, is not a measure of the outcome, it’s a good start to assess a Member of Parliament’s dedication and efficacy in delivering services and development to the constituency that elected him or her.
