The Modi-Chidambaram GDP Slugfest & Beyond
The Congress-Bharatiya Janata Party (BJP) war of words is getting shriller with each passing day as the 2014 general election comes closer. We reckon even pointing this out is passe now.
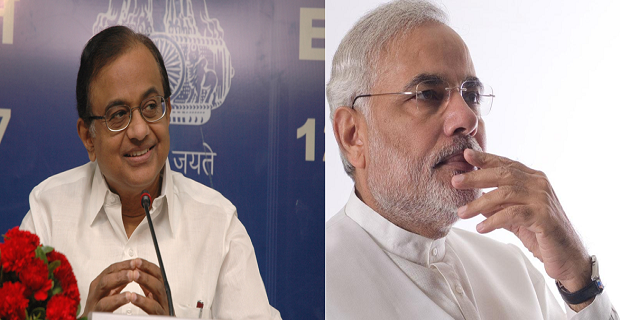
A few days ago, BJP’s Prime Ministerial candidate Narendra Modi claimed the Indian economy had grown at 8.4% till 2004 during the National Democratic Alliance (NDA) regime led by Atal Bihari Vajpayee.
Finance Minister P Chidambaram was quick to counter that. He said Modi was staging a "fake encounter with facts" regarding his claims of growth during NDA being 8.4%. “Nothing could be further from the truth.”
If we look at the gross domestic product (GDP) growth figures during the NDA regime, the highest growth was seen in 1999-00 at 7.5%, according to Planning Commission data. The period 2002-03 saw the lowest growth under the NDA rule at 3.9%. So, it does seem that the Finance Minister’s claim was accurate with regards to NDA’s tenure
Figure 1
BJP secretary Ravi Shankar Prasad later responded to the Finance Minister’s claim by saying that Modi has quoted the Economic Survey figures for the growth rates achieved during the NDA regime.
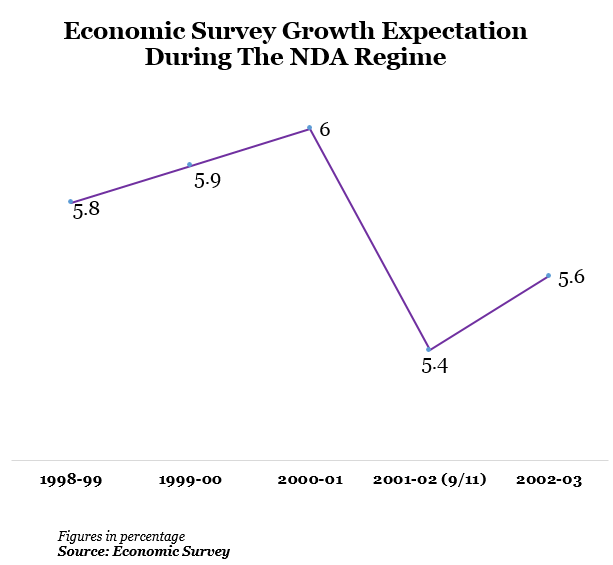
We also looked at the Economic Surveys from 1998-99 till 2002-03. We see here that 6% was the highest expected GDP growth during 2000-01. The lowest growth rate expectation was in the following year (2001-02) with 5.4%. According to the Economic Survey, the decline was due to the terror attacks on the United States on 9/11.
Figure 2
So, Modi’s claim of over 8% growth during the NDA regime might not be accurate.
While looking at the data from Planning Commission, we also came across a few other interesting data points.
Figure 3
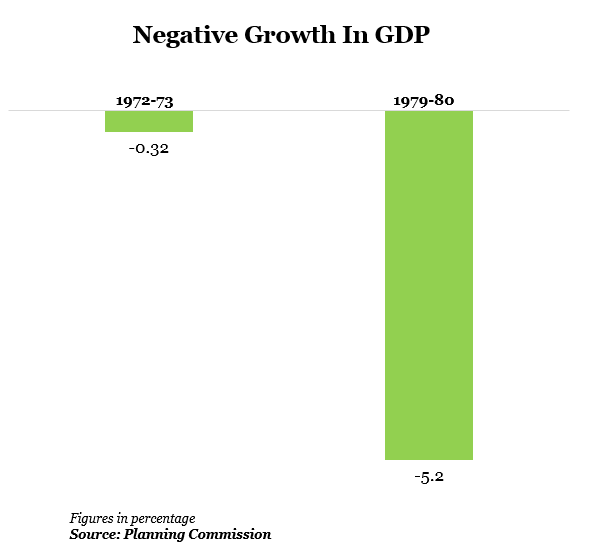
The reason for the negative growth in 1972-73 was unsatisfactory agriculture production and war with Pakistan on the issue of Bangladesh. In 1979, the negative growth was due to a severe drought.
2) GDP (actual value) doubled the first time after 17 years: i.e.from Rs 595,741crore in 1971-72 to Rs 1,013,866 crore in 1985-86. The next doubling occurred in 10 years, which was 7 years less than the previous period. In 1998-99, the GDP increased to Rs2,087,828crore. Finally, the GDP doubled again in 7 years i.e. GDP doubled from Rs. 2,087,828crore in 1998-99 to Rs 5,503,476crore in 2012-13. So, it can be seen that with every doubling of the GDP figure, the time required has also come down.
Figure 4
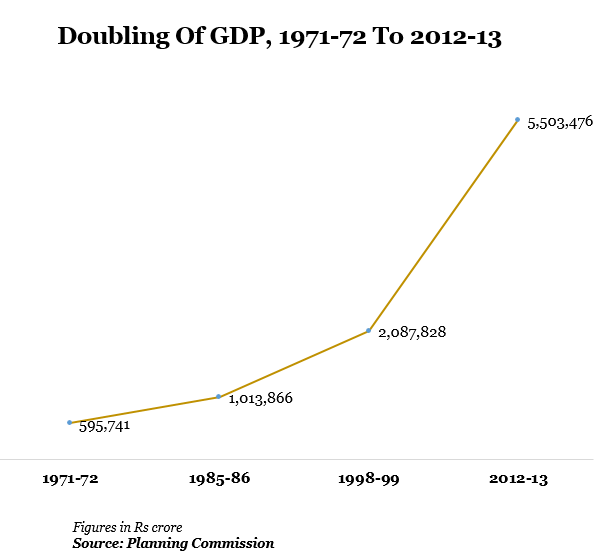
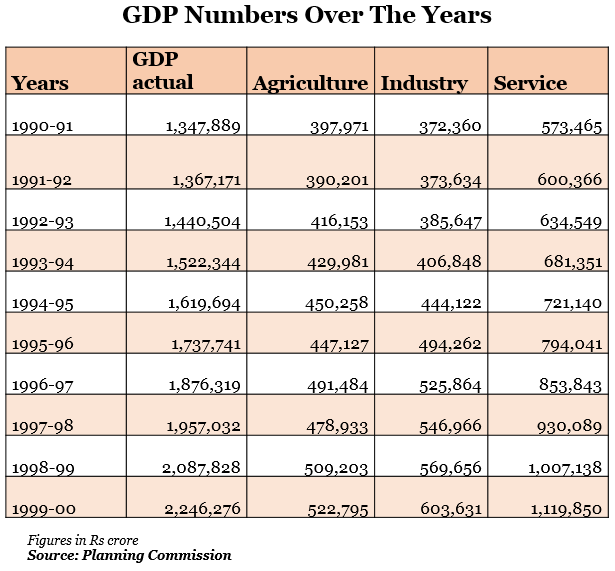
3) The share of agriculture has comedown steadily from 1971 to 2013 while the industry GDPhas gone up and the GDP figures have doubled for the services sector. If we look at the table below, we can see that GDP has actually tripled from Rs. 1,347,889 crore in 1990-91 to Rs5,503,476 in 2012-13. Most of this increase in GDP was due to rise in the services sector, which increased its share from Rs 573,465 in 1990-91 to Rs 3,263,196 crore in 2012-13 which more than 4 times the increase from its size in 1991. The industry sector has increased twice from Rs372,360crore to Rs1,487,533crore during the same time period.
Table 1
Table 2
If there was some good news we could glean, it is that India is generally a growth economy or is on the path. The current economic scene is obviously not very comforting but maybe it’s time to look deeper into the numbers and see how much of the growth would have happened anyway, once the economy liberalized. And how much political leadership contributed to it. We are not saying anything, merely trying to create a fresh ground for debate.


