Rich-Poor Gap Widens In Urban & Rural India

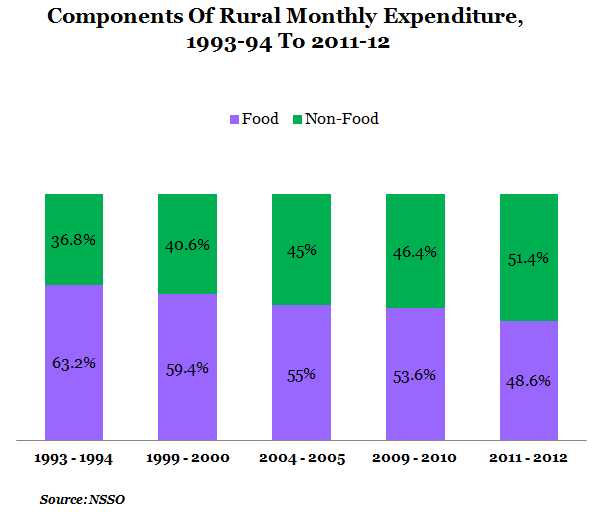
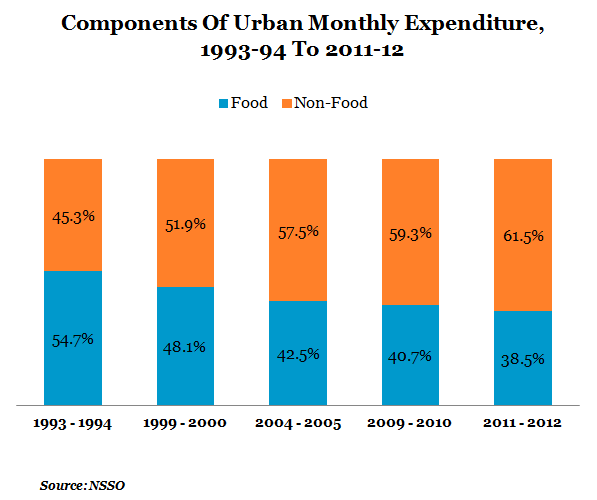
| Highlights * The median monthly per capita expenditure (MPCE) increased 33% in rural areas and 34% in urban areas between 2009-10 and 2011-12. * While rural households are spending more on healthcare, urban households are spending more on transportation. * Food is accounting for lower spends in both rural and urban areas. Spending on non-food products in rural areas increased from 46% in 2010 to 51% in 2011-12 while it increased from 59% to 61% in urban areas. |
Spending patterns continue to shift in urban and rural India. As do needs. Food is no longer the predominant expenditure head as the latest National Sample Survey Organisation (NSSO) survey report says. Instead, the combination of healthcare and transport has taken up a substantial share of rural spends.
Rural areas historically spent more on food products (63.2%) than did the urban areas (54.7%), according to a NSSO report that dates back to 1993. However, in the 2011-12 report, non-food products overcame food-product expenditure overall in both rural (51.4%) and urban (61.5%) categories. On the other hand, the poorest of the poor in India survive on Rs 17 per day in villages while it increases only to Rs 23 for those living in towns and cities.
Increase in Average MPCE
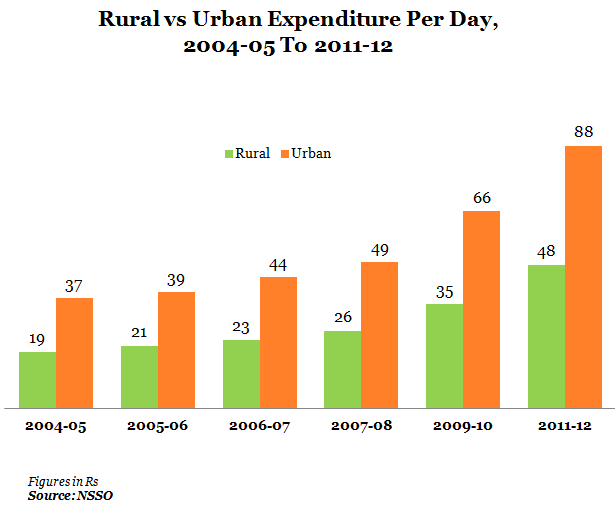
Indian consumers currently spend around 35% more per month than they did two years ago. The 2009-10 NSSO report showed that, on an average, rural and urban consumers spent Rs35and Rs 66, respectively, per day. In contrast, rural and urban consumers spent Rs 48 and Rs 88, on an average, according to the 2011-12NSSO survey. However, in real terms, this amount should be less if adjusted for inflation.
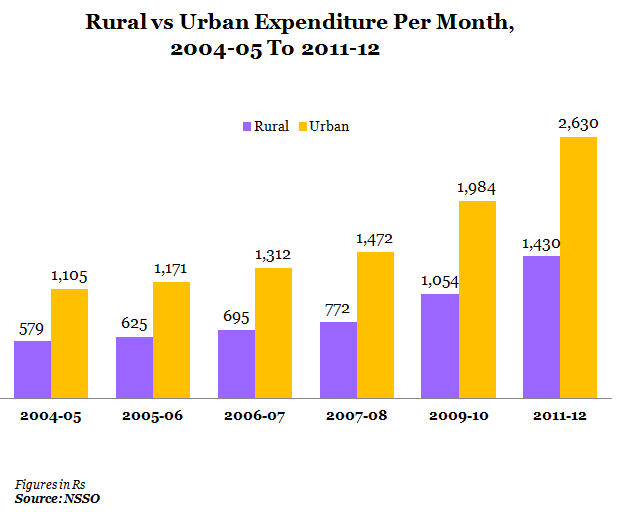
It can be seen from the table above that Indian consumers’ expenditure follows a growing trend. For example, from 2007-08 to 2011-12, spending by rural consumers increased from Rs 772 to Rs 1,430 per month. Over that same period, urban consumer spend rose from Rs 1,472 to Rs 2,630 per month. As we can see, urban consumers’ MPCE multiplies at around twice the rate than their rural counterparts.
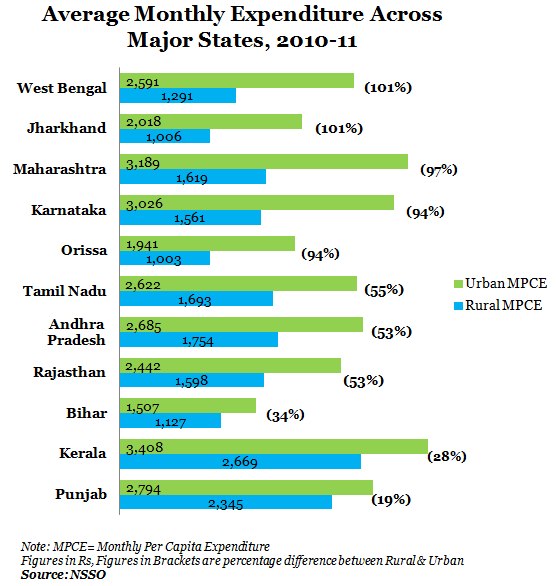
The highest rural-urban differential is in West Bengal, Jharkhand, Maharashtra, Karnataka and Odisha where urban consumption expenditure is almost double that of rural households. Meanwhile, the difference in expenditure is very low in Punjab (19%), Kerala (28%)and Bihar (34%), suggesting less income inequality between rural-urban households.
Increase in inequality of income within both rural and urban sectors
The gap between the rich and the poor is widening in both rural and urban areas. The median rural MPCE was Rs 1,198, and nearly half the rural population was under this MPCE. Only 10% of reported expenditure above Rs2,296 and only 5% reported expenditure above Rs 2,886.
Divide Continues
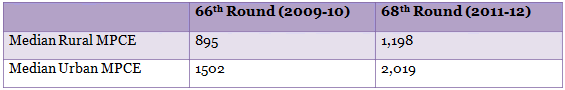
Similarly, in urban India, the average median MPCE was Rs 2,019, and nearly half the urban population fellunder this expenditure. Only 10% reported expenditure above Rs 4,610 and only 5% reported spending above Rs 6,383.
Food And Non-Food Items
Now we look at what is being consumed with the increased expenditure. Over the years, consumers’ spending on food products has declined in relation to their spending on non-food products. In other words, education, healthcare, entertainment, transportation, rent and other expenses.
Let us now look at the components of expenditure on food:
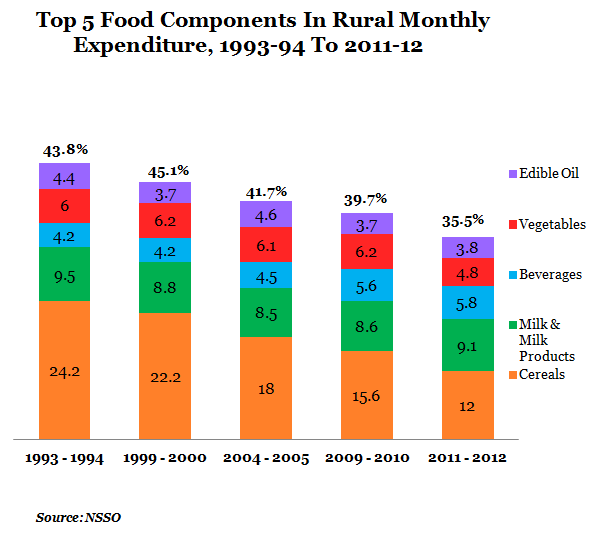
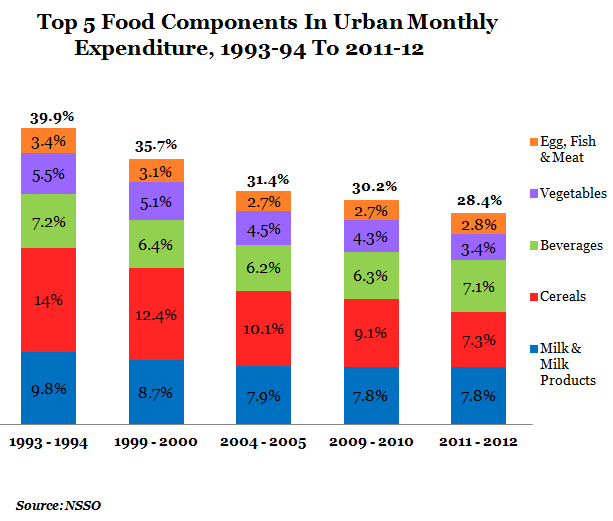
Expenditure on cereals has halved over the past 20 yearsfrom 24.2% of rural MPCE and 14.0% of urban MPCE in 1993-94 to 12% of rural MPCE and 7.3% of urban MPCE in 2011-12. So, urban consumers across India have been shifting their emphasis away from cereals, but towards what? Milk &milk products currently rank higher than cerealsat 7.8% of urban total expenditure. Beverages (7.1%), vegetables (3.4%), and egg, fish, & meat (2.8%) claim the nexthighest expenditures among urban households.
Non-Food Items
When we look at non-food items, miscellaneous goods and services has the highest share of expenditure. Spending on miscellaneous goods & serviceshas increased from 17.3% to 26.1% in the rural parts (an 8.8% increase) and 27.5% to 39.7% in the urban parts (a 12.2% increase) between 1993 and 2012.
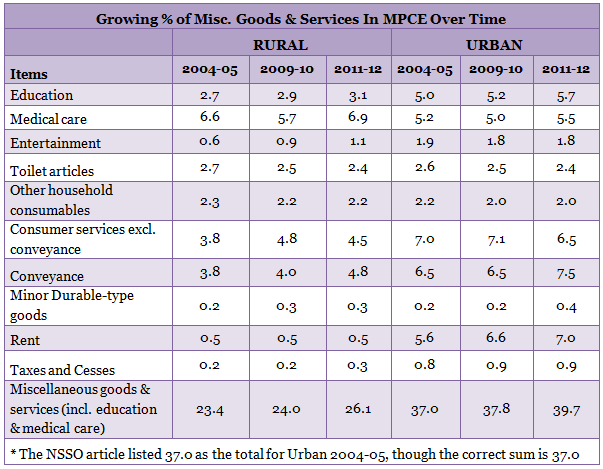
Out of the miscellaneous goods & services section, rural consumers spend the most out of their income on medical care (6.9%) and the second most on ‘conveyance’ (4.8%), or ‘transportation’. Urban consumers, on the other hand, spend the most on ‘conveyance’ (7.5%), and the second-most on ‘consumer services’ (6.5%), or services that exclude conveyance.
Interestingly, 5.7% of urban India’s miscellaneous expenditure budget is for education while only 3.1% of rural India’s spending is for education.
