Patna's Air 5 Times Above Safe Levels, 2.5 Times Worse Than Delhi's
In 2016, the air in Bihar's capital, Patna, was classified the world's sixth-most polluted in a World Health Organisation (WHO) ranking of 3,000 cities in 103 countries. There are 10 Indian cities among 20 globally with the most polluted air.
Now, data from #Breathe--IndiaSpend's network of air-quality sensors--reveal that Patna's air quality over the last month was five times above the air quality guidelines recommended by WHO. Data from our sensors recorded between 13 May and 14 June, 2016 revealed "very poor" air quality 28% of the time, meaning that possible health impacts were respiratory illness at prolonged exposure.
Over the same period and time, Delhi's PM 2.5 levels were twice above the same WHO guidelines.
PM 2.5 refers to particulate matter known to pose the greatest threat to human health, smaller than 2.5 micrometers, or roughly 1/30th the thickness of the human hair. These particles can be inhaled deep into the lungs, causing heart attacks and strokes, which account for three-quarters of 3.3 million deaths--including 645,000 in India--every year globally, according to this 2015 study from Harvard University.
Over 29 days, IndiaSpend's four sensors recorded "good" air quality in Patna only 18 times, all late at night or early morning. "Good" implies an air quality index (AQI) reading below 50. The AQI is a composite measure of various pollutants.
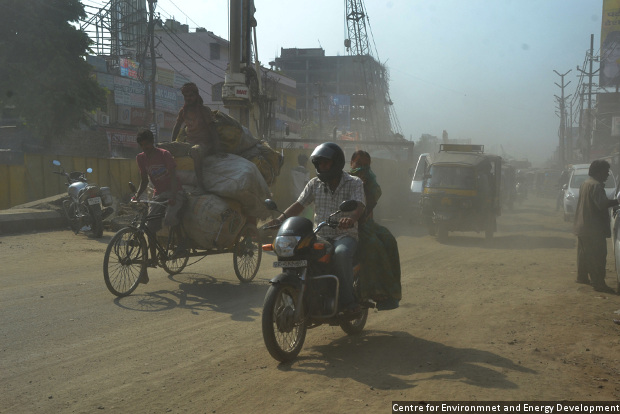
"The high level of particulate matter concentration is adversely affecting the people in the city," said this report from the Centre for Environment and Energy Development (CEED), an advocacy that partnered IndiaSpend and analysed Patna's data. "The chief causes of the rampant deterioration of the air quality in the city are population growth, traditional cooking practices, power plants, dirty brick-making practices, industries, solid waste burning, increased vehicle use and construction activities in Patna."
Patna has risen in the WHO rankings, from second in 2015 to sixth in 2016. This does not mean the city's air improved, according to CEED analysts.
"While the new ranking is indicative of an improvement, it cannot be entirely trusted as the current listing is based on data from the year 2013, which is similar to the last listing of WHO (May 2014)," said the CEED report. "The ranking thus, are quite deceptive."
"Bihar has witnessed a double digit growth in terms of Gross Domestic Product (GDP) rate in last five years," the CEED report said. "However, this growth has come with a heavy price. The city’s environment has suffered majorly in terms of its air quality, making Patna one of the most polluted cities in the country and across the globe."
The worst air quality our sensors recorded was at Patna Junction--the main railway station at the city's heart--where on 20 of 27 days, the average AQI jumped over 400, above the last level rated "severe", which affects healthy people and seriously impacts those with existing disease.
Even the best performing station, at Gandhi Maidan, experienced "poor" to "very poor" air quality for two of every five days. A "poor" rating implies breathing discomfort to most people on prolonged exposure, and a "very poor" rating implies respiratory illness on prolonged exposure.
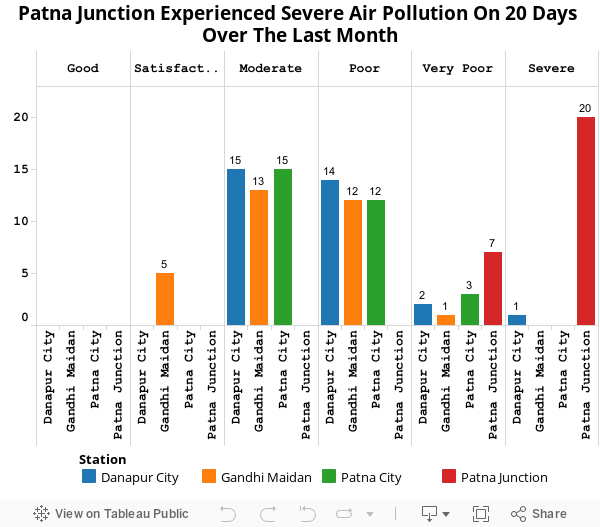
Source: #Breathe, IndiaSpend's air-quality sensor network. Data for 13 May to 14 June, 2016
Particulate matter in air increases as the day progresses
Average PM 2.5 and PM 10 levels rose steadily through the day in Patna and peaked at close to 180 and 300, respectively, in the evening. PM 10, or coarse particulate matter with diameter between 2.5 and 10 micrometers, are primarily made up of dirt and dust from farming, factories and roads.
The levels of PM 2.5 and PM 10 were highest during the afternoons. The nights were nearly as bad. "The mornings were equally bad but slightly better than the nights," said the CEED report.
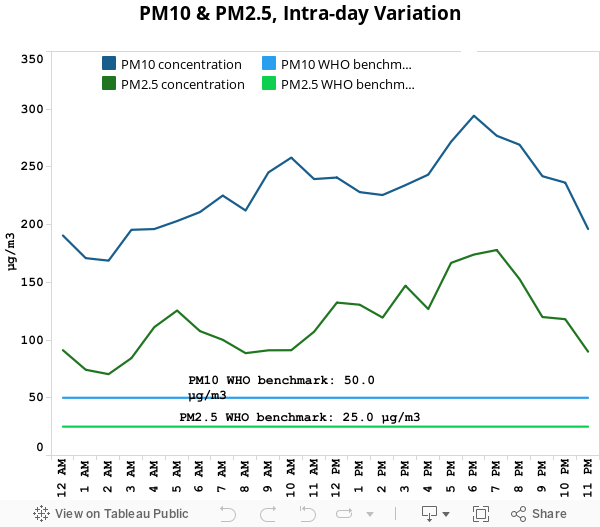
Source: #Breathe, IndiaSpend's air-quality sensor network. Data for 13 May to 14 June, 2016
Gwalior and Allahabad place higher than Patna on 2016 WHO air pollution survey rankings. However, in terms of the worst ambient air quality in the world, Patna ranks third.
The global air-quality rankings of cities are determined by PM 2.5 and PM 10 levels. As the chart below shows, the air quality steadily worsened over two years to 2016 in 18 Indian cities with the worst air quality:
| Indian Cities With The Worst Air Quality, Top 18 (2014 and 2016) | ||||||
|---|---|---|---|---|---|---|
| PM 2.5 Rank | PM 2.5 | PM 10 | ||||
| City | 2014 | 2016 | 2014 | 2016 | 2014 | 2016 |
| Gwalior | 3 | 1 | 144 | 176 | 329 | 329 |
| Allahabad | 11 | 2 | 88 | 170 | 202 | 317 |
| Patna | 2 | 3 | 149 | 149 | 164 | 167 |
| Raipur | 4 | 4 | 134 | 144 | 305 | 268 |
| Delhi | 1 | 5 | 153 | 122 | 286 | 229 |
| Ludhiana | 10 | 6 | 91 | 122 | 207 | 228 |
| Kanpur | 8 | 7 | 93 | 115 | 212 | 215 |
| Khanna | 12 | 8 | 88 | 114 | 200 | 213 |
| Firozabad | 7 | 9 | 96 | 113 | 219 | 212 |
| Lucknow | 6 | 10 | 96 | 113 | 219 | 211 |
| Amritsar | 9 | 11 | 92 | 108 | 210 | 202 |
| Gobindgarh | 16 | 12 | 69 | 108 | 159 | 201 |
| Agra | 12 | 13 | 88 | 105 | 200 | 196 |
| Jodhpur | 14 | 14 | 86 | 101 | 196 | 189 |
| Dehradun | 15 | 15 | 77 | 100 | 175 | 188 |
| Ahmedabad | 5 | 16 | 100 | 100 | 67 | 83 |
| Jaipur | 17 | 17 | 68 | 100 | 155 | 187 |
| Howrah | 18 | 18 | 47 | 100 | 108 | 186 |
Source: WHO Global Urban Ambient Air Pollution Database 2014, 2016
| Air Quality Index | ||
|---|---|---|
| AQI Category | PM 10 Level | PM 2.5 Level |
| Good (0-50) | 0-50 | 0-30 |
| Satisfactory (51-100) | 51-100 | 31-60 |
| Moderate (101-200) | 101-250 | 61-90 |
| Poor (201-300) | 251-350 | 91-120 |
| Very Poor (301-400) | 351-430 | 121-250 |
| Severe (401-500) | 430+ | 250+ |
Source: Central Pollution Control Board; Levels in micrograms per cubic metre (µg/m³)
Only three times during our study did PM 10 concentrations reach a "moderate" level, meaning breathing discomfort for people with sensitive lungs, asthma and/or heart diseases.
Similarly, PM 2.5 levels were highest in the morning, afternoon and midnight, staying above safe levels 70% of the time.
Patna air more than twice as polluted as Delhi's
The average AQI in Patna over the past month (13 May to 14 June, 2016) is more than twice the average AQI recorded by our sensors in Delhi and nearly six times the average AQI in Mumbai over the same time period. On 14 of the last 33 days, the average quality of air in Patna has been worse than the most polluted location in Delhi, RK Puram Sector 9.
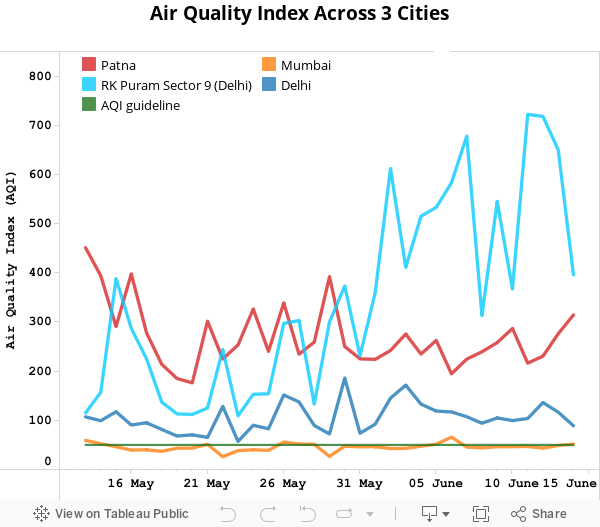
Source: #Breathe, IndiaSpend's air-quality sensor network. Data for 13 May to 14 June, 2016
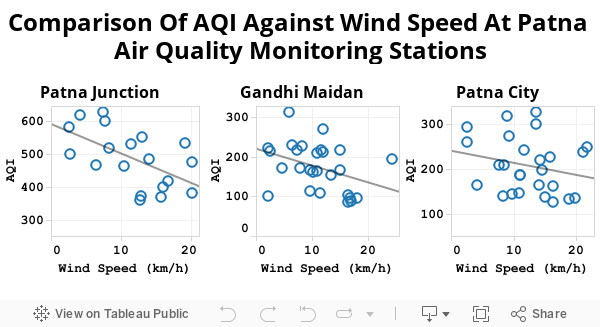
Windy days witness better air quality
Days that experience greater wind speed also tend to experience lower levels of air pollution, according to data of average wind speed and AQI from IndiaSpend's Gandhi Maidan, Patna City and Patna Junction sensors. Readers are advised to exercise caution while interpreting these results since a thorough understanding of effect of wind speed on air quality index (AQI) requires additional in-depth analysis.
Source: #Breathe, IndiaSpend's air-quality sensor network. Data for 13 May to 14 June, 2016
What can be done? The government has to step in
Patna need a "clean-air action plan", said the CEED report. The city first needs an alarm system of "red-alert days" when levels are very high, or off the scale, as our data show.
The government must build a mass-transportation system and ensure vehicles use cleaner fuel. The report recommends the government move up Bharat stage IV--cleaner fuel than is presently used--requirements from the target date of April 1, 2017.
Since Patna's economy is driven by diesel--both industrial and agricultural sectors--the city needs to implement roof-top solar power and other power-saving measures on "a war footing", the CEED report said. Patna would also need to evolve a schedule to shut down a nearby polluting power plant (in Muzzafarpur). The city also needs to stop the burning of garbage, coal, control construction dust and plant more trees and green the verges of roads.
Note: The data for this study were obtained from IndiaSpend sensors; the values were sampled every five minutes and aggregated every hour. The obtained value was then converted into particulate matter, with a 24-hour concentration value, as prescribed by Central Pollution Control Board.
(Bapat is an intern with IndiaSpend.)
We welcome feedback. Please write to respond@indiaspend.org. We reserve the right to edit responses for language and grammar.
__________________________________________________________________
Liked this story? Indiaspend.org is a non-profit, and we depend on readers like you to drive our public-interest journalism efforts. Donate Rs 500; Rs 1,000, Rs 2,000.
