Needed For Indian Schools: Students & Teachers

The good news for Indian primary school education is that larger Indian states like Uttar Pradesh and Madhya Pradesh are now building adequate infrastructure for primary and secondary schools.
The bad news is that access to schools is still a major challenge for children as is the availability of teachers, acute in states like Bihar and West Bengal.
Not surprisingly, many big states still languish at the bottom of the Education Development Index (EDI) released recently by the District Information System for Education (DISE).
The purpose of computing an EDI, released with the Flash Statistics 2013-14, is to know the comparative status of a state vis-à-vis other states with regard to different aspects of universalisation of education. The index summarises various aspects related to input, process and outcome indicators and identify geographic areas that lag in overall education development.
IndiaSpendhad earlier looked at the basic results, which showed how some union territories and small states have done very well in the index. The main concern, however, is with bigger states which have a larger proportion of children thanks to a high population. We have excluded the northeastern states, union territories and hilly states from our analysis since their geographical conditions and administrative set up don’t compare with the rest of country. We will be looking at the results of big states with respect to their EDI ranks and scores. The following table shows the top 5 big states with respect to EDI ranks:
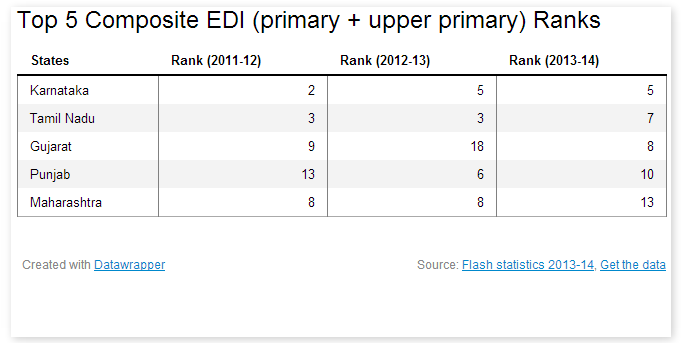
Karnataka is at 5th rank, the highest for any big state. The state has continued to maintain its rank from last year but the state has slipped from its second position in 2011-12. The state has also scored a 5th rank in primary education EDI and 7th rank in the upper primary section.
Tamil Nadu follows Karnataka in the composite EDI rankings but the state has actually slipped from 3rd rank in 2011 and 2012 to 7th rank in 2013-14.
There has been an improvement in the ranking for Gujarat from 18th to 8th in 2013-14. Punjab has actually fallen from 6th place in 2012-13 to 10th place in 2013-14 and Maharashtra has slipped from 8th place in 2012-13 to 13th position in 2013-14.
If we look at the primary and upper primary EDI rankings among the big states, Tamil Nadu ranks 4th on primary school EDI rankings and ranks 6th in the upper primary section.
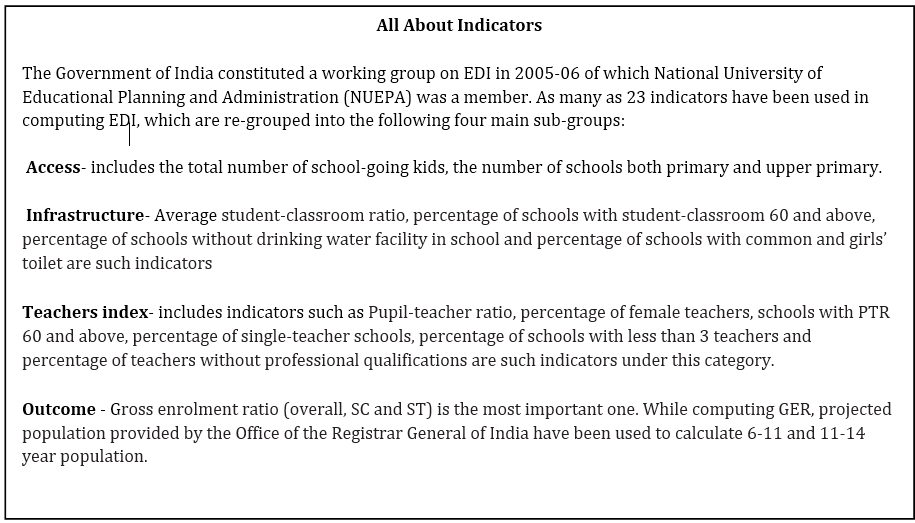
Let us now look at the reasons why these particular states have done so well. An idea about that can be gauged from their performance in the four main indicators; access, teachers index, infrastructure and outcome(Read Box On Indicators).
We can see that most of the top five states are doing quite well on the infrastructure side of things for primary schools. And most of the states are not doing well in access indicators with Tamil Nadu having the lowest score of 0.2.
If we look at the upper primary scores, access and outcomes results are not satisfactory while infrastructure and teachers EDI are doing quite good for the top five states.
Let us now look at the big states that did not do so well in the index. The following table shows the composite index for the bottom 5 states.
Bottom 5 composite EDI (primary + upper primary) ranks
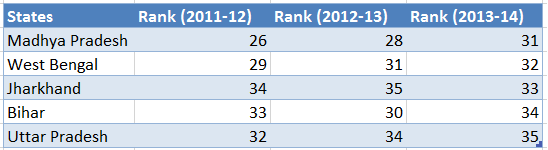
Madhya Pradesh leads the table with 31st rank and Uttar Pradesh, the most populous state of the country (199 million), is right at the bottom of the table with 35th rank (last rank). It can also be seen that all the states, except Jharkhand, have seen a fall in their ranks from last year. Jharkhand has seen an improvement over its last year’s rank from 35th to 33rd in 2013-14.
Let us look at the rankings according to the scores on different indicators:
Bottom 5 (primary EDI Scores)
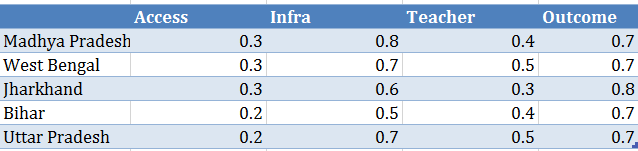
A surprise here is the high scores on learning outcomes and infrastructure: almost all states have scores between 0.5-0.8. Access continues to be an issue in almost all the five states in both primary and upper primary sections.
Conclusion
It is interesting to see that the outcome indicators, which calculate the gross enrolment ratio (overall, SC and ST) and ratio of exit class over Class I enrolment, are pretty such similar for both the top five and bottom five states. One reason for this is that a few states reported this to be above 100%, which is treated as missing values in EDI computation. Hence, this indicator cannot be used to determine anything.
Access is a concern for both the top five as well as the bottom five states. The Governments could either build more schools or improve roads and public transport to ensure that more children can access their schools in nearby villages, towns or cities.Infrastructure indicators within the school have seen an improvement in both top and bottom states.
The teacher’s index can be looked at as a deciding factor between the top and bottom states. Forthe top five states, the average range is between 0.8 to 0.9 while for the bottom five states, the lowest score is 0.2 and the highest is 0.6. This indicator highlights the disparity between the availability of teachers.
So, although the index is quite comprehensive, it lacks information on the qualitative aspects of education. For example, the outcome data focuses solely on enrollment and gender parity but does not talk about the test scores or the quality of education received by the students. The teacher’s index also focuses on the number or the availability of teachers and does not bring out the quality of education they impart to the children.