Share Of Regular Salaried Work Rises, But Women More Likely To Be Self-Employed

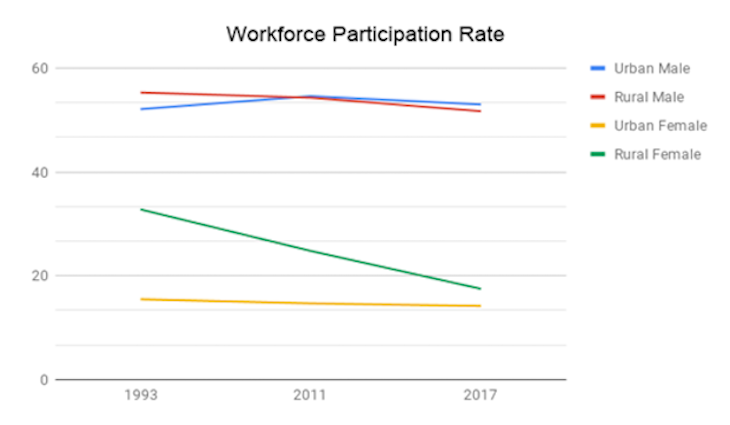
Bengaluru: India’s workforce has fewer women than it did six years ago: no more than 18% in rural areas are employed, compared to 25% in 2011-12 and 14% in urban from 15%. However, in urban areas, the percentage of women in salaried jobs has increased from 35.6% in 2004 to 52.1% in 2017, but continue to be under-represented compared to their presence in self-employed or casual work, according to an analysis of the latest government employment data by Azim Premji University researchers.
Both men and women in rural and urban India are out of work, but there is a continuing decline of the number of women in the workforce, the latest government data, collected by the Periodic Labour Force Survey (PLFS) 2017-18, found.
Four months after a leaked newsbreak of national employment data revealed that India’s current unemployment rate was at a 45-year high, the government released the official PLFS report on May 31, 2019.
Understanding the survey
The PLFS report, released after many controversies, provided quarterly estimates on labour market indicators by gender, education and caste. In 2017, PLFS had replaced the National Sample Survey Office’s Employment Unemployment Survey (NSS EUS) that was conducted every five years since 1972-73.
The PLFS report compares current data with NSS EUS, but the two differ in terms of methodology as well as the questions asked of the 433,339 persons surveyed in both rural and urban areas. Some argue that the two surveys remain broadly comparable, while others think it is like comparing apples to oranges.
While the sampling strategy has changed between the two surveys, statistical techniques ensure that the estimates of the NSS EUS and PLFS are comparable. Moreover, the broad questions used to capture labour force status remain unchanged between the surveys.
Women on the job
In 1993, nearly 33% of rural women were employed. By 2011-12, the last time the NSS EUS was conducted, this had fallen by eight percentage points to about 25%. The proportion of urban women dropped one percentage point to 15% in the two decades to 2011-12.
The 2017-18 PLFS estimates indicate a further decline. Rural women’s workforce participation has fallen to 18%, and the participation of urban women is down to 14%.

Source: Periodic Labour Force Survey (PLFS) 2017-18
More women in regular, salaried employment
The vast literature on the falling female workforce participation provides some reasons for this decline. One explanation is that women withdraw from the workforce due to an ‘income effect’, that is an increase in the husband’s income which pushes up the household income (Kapsos et al., 2014). Another reason is that women’s domestic and childcare responsibilities constrain them from participating in the labour market (Chaudhary and Verick, 2014).
Some argue that women are withdrawing from the workforce to pursue higher education (Kingdon and Unni, 2001), while others contend that there is a lack of good jobs for women (Chatterjee et a., 2015).
However, there is some evidence which suggests that educated women with higher skills are demanding better jobs in cities: The few women who do participate in the urban workforce are increasingly employed in regular, salaried jobs.
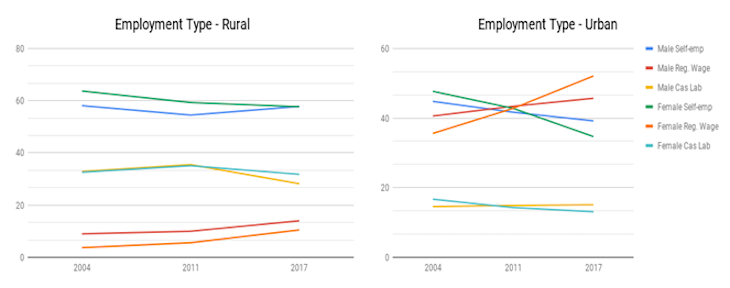
Of all the women in the workforce in 2004, 35.6% were in the regular salaried category in urban areas. By 2017, their representation had increased to 52.1%. Thus, the PLFS report shows that an increasing share of women are now being employed as regular salaried workers, rather than self employed or casual workers. For self-employed workers, their share in the workforce fell from 47.7% to 34.7% in urban areas between 2004 and 2017. In the same period, the share of women workers in casual labour also declined from 16.7% to 13.1%.
Rural areas saw a similar pattern during this period, with a rise in the share of women in regular, salaried category and a decline in casual labour and self employed work. This rising share of women in regular work is a welcome development. Despite this rise, women continue to be under-represented in regular, salaried employment.

Source: Periodic Labour Force Survey (PLFS) 2017-18
We use the Representation Index (RI)--the ratio of the share of men or women in an employment type divided by the share of that gender in the entire workforce--to estimate men and women’s representation in employment categories.
If the ratio is less than one, it means that the group is under-represented and a ratio greater than one indicates the group’s over-representation in that employment category.
We find that women are over-represented in self-employed and casual work categories with an RI of 2.23 and 1.61, respectively. In regular employment type, however, women are under-represented with an RI of 0.9.
Thus, even if women’s participation as salaried workers has increased over time, they continue to be under-represented. And, when women do work, they are more likely to work as self employed or casual workers.
Women’s income compared to men’s
The PLFS introduced a question to capture data on earnings from self-employment. As a majority of workers in India are self-employed, it was an important addition the previous surveys had overlooked. These data on income now allow a comparison between how much men and women earn across employment categories.
The raw gender gap, measured as the difference in the average earnings of men and women in the regular, salaried category, shows that men earn Rs 4,594.5 more in rural settlements and Rs 3,429.75 more in urban settlements. That is, women earn Rs 70 and Rs 80 for every Rs 100 that men earn in rural and urban areas, respectively.
We found that among self-employed workers, men earn more than two times what women earn in both rural and urban areas. However, the information on earnings from self-employment is prone to reporting errors and has to be approached with caution. The estimates’ reliability can be ascertained only after comparing it with alternate data sources.
The hours men and women are putting in
The information on hours worked is another addition to the PLFS questionnaire. This is measured as the average number of hours worked in a week during the four quarters of the survey period from July 2017 to June 2018.
There are no significant differences between the percentage of men and women available for additional work in rural areas. In urban settlements, however, women workers in the self-employed and regular work categories report more hours available for work than men.
When self-employed, men work 12 hours more than women per week. And in regular and casual employment, men work seven hours more than women in a week. However, this does not necessarily imply that women work for fewer hours since women’s unpaid work is not accurately captured. The data on the number of hours worked can be better utilised after understanding women’s unpaid contribution inside and outside the household.
We are now awaiting the NSS Time Use Surveys’ data. Once released, it will help present insightful observations on how men and women spend their time on economic activities.
This is part one of a two-part series that attempts to explain the evolving role of women in the Indian workforce.
(Shibu and Abraham are researchers at Azim Premji University.)
We welcome feedback. Please write to respond@indiaspend.org. We reserve the right to edit responses for language and grammar.


