It’s Not About Which Community You Belong, It’s About How Educated It Is
| Highlights* Christians doing well across the country as they have better education, better jobs and better standard of living. * Sikhs have the highest monthly per capita expenditure (MPCE) - both in rural and urban areas - followed by Christians and Hindus * For Muslims, lower education leads to higher unemployment and lower standards of living along with dwindling position of women
|
It does not matter which community you hail from in India but there are some things which are consistent across India. The crux, as data shows, is education. This might sound and seem axiomatic but the fact is that the more educated a community, the better its overall social indicators. And economic as well.
The National Sample Survey (NSSO), based on 2009-2010 demographics, education and employment, found, for instance, that Christians across the country seem to be doing well as they have better education, better jobs and better standard of living, which is reflected in their monthly expenditure. This is the last Survey that focussed on communities.
Christians represent only 2.4% of India’s population. But on the other hand, data on Muslims across the country shows that lower education leads to higher unemployment, lower standards of living and dwindling position of women, for instance sex ratio and participation in labour force.
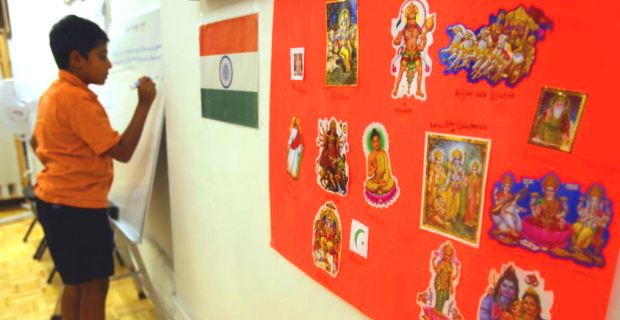
Let us start with a look at the background demographics, according to religious communities.
Figure 1
Nearly 84% households in rural India were Hindu followed by 12% Muslims, 2% Christians and others (including Parsis, Sikhs, Jains and Buddhist) 2%. In urban India, 79% were Hindu, 16% were Muslims, 3% were Christians while others were 2%.
Let’s break it down state-wise. More than 90% of households in Chhattisgarh, Himachal Pradesh, Madhya Pradesh and Orissa were Hindu. Jammu & Kashmir had the highest population of followers of Islam while Kerala has 21% of people who are Christians. It’s likely that Kerala’s overall good numbers help improve the average for the Christian community in the context of social and economic indicators. Or the other way around.
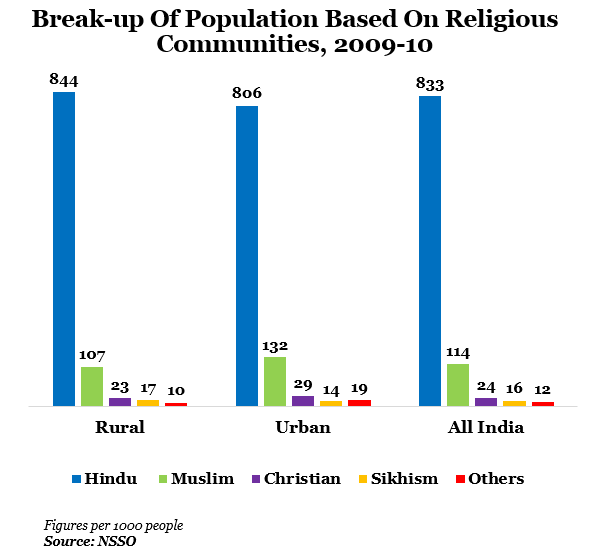
Let us now look at the sex ratios of different communities:
Figure 2
The sex ratio (number of females per 1,000 males) is an important indicator of social condition, particularly with respect to women’s status. The sex ratio among Christians was the best among all religious groups with 1,012 females per 1,000 males in both rural and urban India.
Hindus had a sex ratio of 949 girls per 1,000 males while it was 921 girls for 1,000 males among Muslims in rural areas. In urban areas, the sex ratio was the worst among Hindus with only 902 girls per 1,000 boys and Muslims were second with 923 girls for every 1,000 males.
Interestingly, the sex ratio has turned for the worse among Hindus over the past 10 years in urban areas wherein the number of girls per 1,000 males had declined from 912 to 902 between 1999-2000 and 2009-10.
In rural areas, the number of girls came down from 952 to 949 in the same time period. While there was a decline in the sex ratio of 6.9% in rural areas among Muslims, it improved by 1.2% in urban areas in the same period.
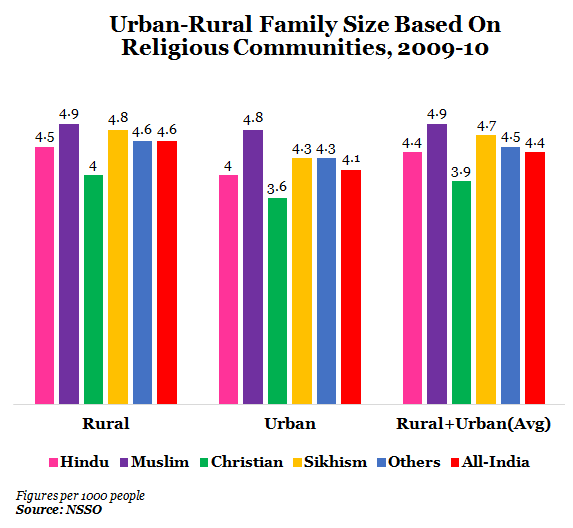
Now a look at the family size: the all-India household size was 4.4 while the highest was among Muslims at 4.9 followed by Sikhs (4.7). The lowest was among Christians with 3.9 members per family.
Figure 3
Educational attainment represents human capital accumulation, and determines, to a large extent, the employment prospects of an individual. The literacy rates for overall rural males, rural females, urban males and urban females were 74%, 50%, 90% and 76%, respectively.
Figure 4 (a)
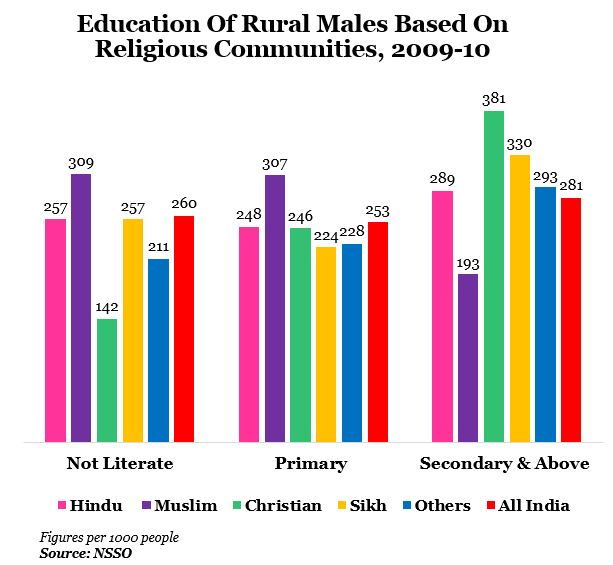
Figure 4 (b)
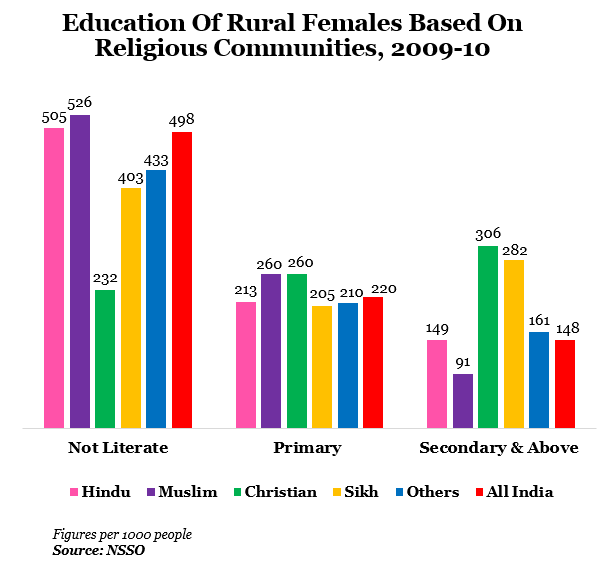
Figure 4 (c)
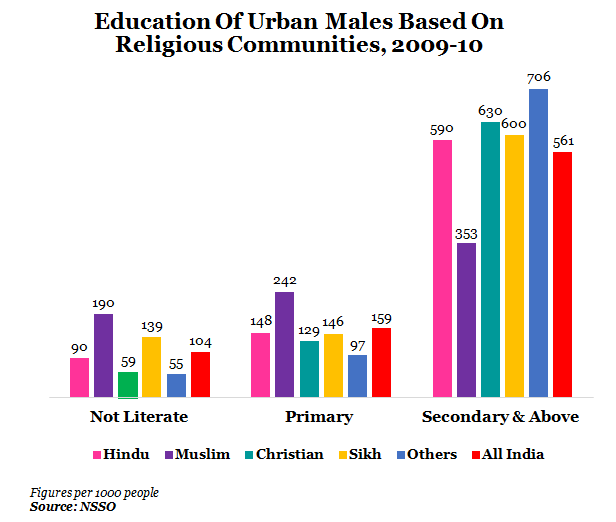
Figure 4 (d)
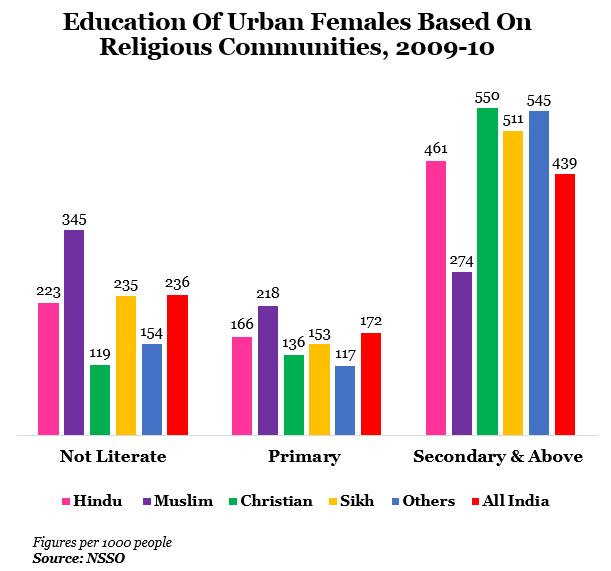
Literacy among Christians was 86%, 77%, 94% and 88% for rural males, rural females, urban males and urban females, respectively. Among Muslims, the literacy rates for rural males, rural females, urban males and urban females were 69%, 47%, 81% and 65%, respectively.
Not only did Christians have higher levels education among all communities, they were also the highest in the secondary and above educational level with 38 per cent, 31 per cent, 63 per cent and 55 per cent, for rural males, rural females, urban males and urban females, respectively.
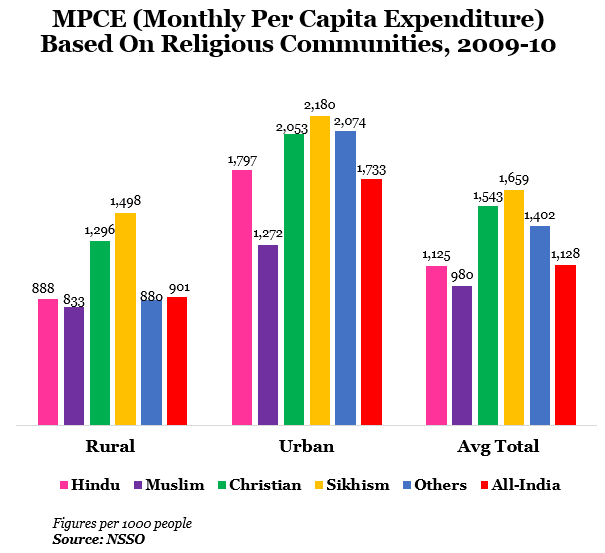
Higher Standard of Living
Sikhs have the highest monthly per capita expenditure (MPCE) in the country - both in rural and urban areas followed by Christians and Hindus. At the all-India level, the average MPCE of a Sikh household was Rs 1,659 (Rs 2,180 in urban areas and Rs 1,498 in rural areas) while that for a Muslim household was only Rs 980 (Rs 1,272 in urban areas and Rs 833 in rural areas).
Figure 5
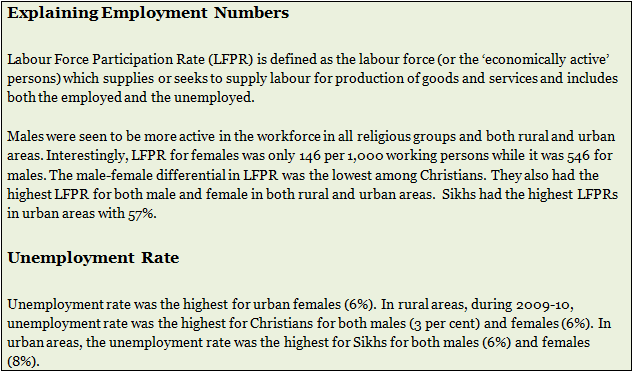
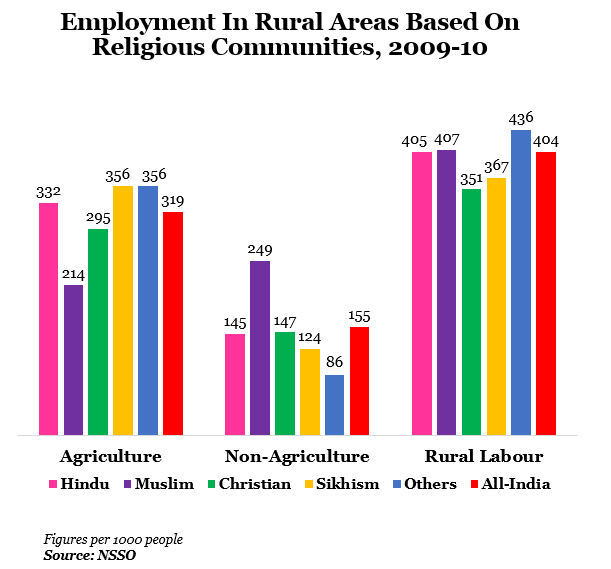
The Workplace
Self-employment - in agriculture and non-agriculture together - was the major source of earnings for a large number of households of all religious groups. In rural areas, 47% households belonged to the household type - self-employed in agriculture or self-employed in non-agriculture. Households categorised as ‘rural labour’ was the highest among Muslims at 41%.
This division of labour can be explained since most Muslim households (91%) and Christian households (86%) own less than 1 hectare. On the other hand, Sikhs and Hindus were among the groups that owned more than 4 hectares.
In urban areas, regular/salaried employment was the major source of income. Nearly 43% Christians followed by Hindus (41%) were engaged in regular/salaried employment. Majority of the Muslims, even in urban areas, were engaged in self-employment.
Figure 6 (a)
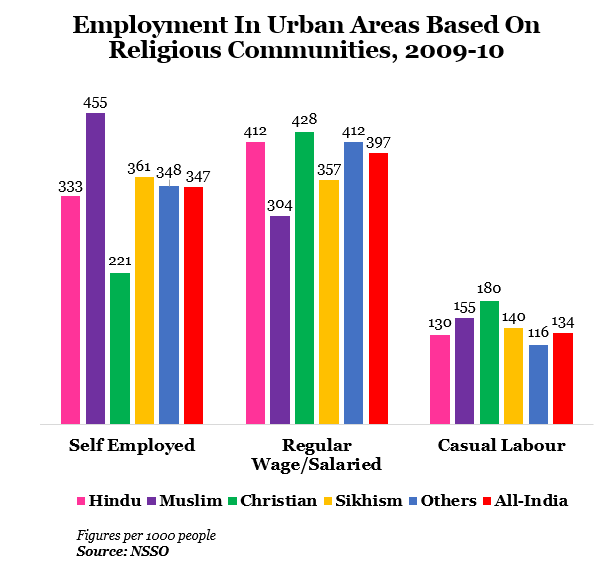
Figure 6 (b)
The Education-Employment Connection
The NSSO study highlights the fact that there is a close relationship between education and employment. Christians, to continue with the illustration we started with, seem to be doing well as they have better education, better jobs and hence a better standard of living.
Another highlight is that Sikhs, who have ensured development through agriculture, seem to be taking education very seriously as seen by their increasing numbers in enrolments.
An improved sex ratio is another indicator that the more educated a community, the better it is for women and also smaller families.