India’s Traffic Nightmare: Roads Grow 4%, Vehicles Grow 11%
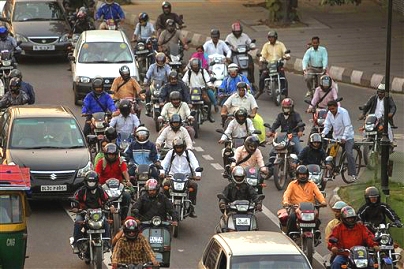 India’s road network has grown at an annual rate of 4% since 1951 but the number of vehicles has increased nearly 11%, choking roads and increasing pollution. IndiaSpend’s Prachi Salve looks at data for the last six decades and comes up with some interesting findings:
India has the second largest road network in the world with 4.2 million km. The road network accounted for 85% of the total passenger movement and nearly 63% of the freight movement during 2009-10.
India’s rural road density (per 1000 population) increased to 4.86 km in 2008 from 4.20 km in 2001 while urban road density increased to 0.91 km from 0.88 km during this period. The reason for the difference is the lower population density in rural areas when compared with urban areas.
Interestingly, even though the increase in road length has kept pace with the rising population, it has not managed to keep pace with the increasing number of motor vehicles. The two tables below show the compound annual growth rates for vehicles and roads.
The number of registered motor vehicles witnessed a compounded annual growth rate of 9.9% during 2001-2011 when compared with the road network, which increased at a CAGR of 3.4%.
Table 1: Vehicles Increasing On The Streets
| Period | 1951-61 | 1961-71 | 1971-81 | 1981-91 | 1999-01 | 2001-11 | 2011-1951 |
| Two Wheelers | 12.5 | 20.7 | 16.3 | 18.4 | 10.5 | 10.2 | 14.5 |
| Cars, Jeeps & Taxis | 6.9 | 8.2 | 5.4 | 9.8 | 9.1 | 10.5 | 8.1 |
| Buses | 5.3 | 5.1 | 5.6 | 7.4 | 6.7 | 6.9 | 6 |
| Goods Vehicles | 7.4 | 7.4 | 4.9 | 9.4 | 8.1 | 9.1 | 7.6 |
| Others* | 26.5 | 15.0 | 18.1 | 10.9 | 8.6 | 8.0 | 14.1 |
| Total | 8.1 | 10.9 | 11.2 | 14.8 | 9.9 | 9.9 | 10.6 |
(Increase in %)
*Others include tractors, trailers, three wheelers (passenger vehicles)/LMV and other miscellaneous vehicles which are not separately classified.
Source: MORTH [ Ministry Of Road Transport & Highways]
Table 2: Roads Increasing but…
| Period | 195-61 | 1961-71 | 1971-81 | 1981-91 | 1999-01 | 2001-11 | 2011-1951 |
| NHs | 1.9 | 0.0 | 2.9 | 0.6 | 5.5 | 2.1 | 2.1 |
| SHs &OPWD | 4.0 | 2.6 | 4.5 | 2.1 | 3.1 | 3.0 | 3.2 |
| Rural | -0.5 | 6.0 | 5.9 | 7.2 | 4.6 | 3.4 | 4.4 |
| Urban | - | 4.5 | 5.5 | 4.3 | 3.0 | 5.0 | - |
| Project | - | - | 3.5 | 1.2 | 0.6 | 2.6 | - |
| Total | 2.7 | 5.7 | 5.0 | 4.6 | 3.8 | 3.4 | 4.2 |
(Increase in %)
OPWD – Other PWD roads
Source: MORTH
The sharp rise in the number of two-wheelers shows the impact of rising income, which, in turn, leads to increasing need for mobility. It also shows the impact of easing supply side constraints (delicensing of the automobile sector leading to the entry of vehicle manufacturers, lifting of quantitative restrictions etc.) and easy access to finance.
In contrast, the slower growth of goods vehicles shows the shifting of economy from commodity-producing sectors (agriculture and industry) towards services. However, this will create, or is creating, problems of congestion and pollution.
Attention Shifting From Cities
Four states constitute almost 46% of the total vehicle registrations in the country. Maharashtra has the highest number of vehicles registered until March 2009 with 14% (14.5 million) followed by Tamil Nadu with 12% (12.9 million), and Gujarat and UP with 10% each.
Table 3: State-wise Number of Registered Vehicles
| Name of the State | Number registered vehicles (in millions) |
| Sikkim | 0.03 |
| Mizoram | 0.07 |
| Meghalaya | 0.14 |
| Tripura | 0.14 |
| Manipur | 0.15 |
| Nagaland | 0.24 |
| Himachal Pradesh | 0.49 |
| J&K | 0.67 |
| Goa | 0.67 |
| Uttarakhand | 0.79 |
| Assam | 1.23 |
| Bihar | 1.96 |
| Jharkhand | 2.04 |
| Chhattisgarh | 2.11 |
| Orissa | 2.61 |
| West Bengal | 3.04 |
| Haryana | 4.42 |
| Punjab | 4.83 |
| Kerala | 4.86 |
| MP | 6.01 |
| Rajasthan | 6.49 |
| Karnataka | 6.95 |
| AP | 8.06 |
| UP | 10.78 |
| Gujarat | 10.99 |
| Tamil Nadu | 12.89 |
| Maharashtra | 14.45 |
| Total | 107.14 |
Source: MORTH
Now let us look at the cities. Delhi has highest number vehicles at 6.3 million. Ahmedabad and Chennai also feature prominently with 1.7 million and 2.9 million, respectively. Another interesting fact is that metros account for only 27% of the total number of vehicle registrations.
Table 4: City-wise Number Of Registered Vehicles
| Name of the City | Number registered vehicles (in millions) |
| Delhi | 6.3 |
| Bangalore | 3.02 |
| Chennai | 2.92 |
| Hyderabad | 2.68 |
| Ahmedabad | 1.69 |
| Mumbai | 1.67 |
| Jaipur | 1.39 |
| Pune | 1.15 |
| Surat | 1.04 |
| Lucknow | 1.02 |
| Nagpur | 1.01 |
| Vadodara | 1.01 |
| Indore | 1.01 |
| Coimbatore | 1.00 |
| Kanpur | 0.64 |
| Bhopal | 0.62 |
| Kolkata | 0.58 |
| Vishakhapatnam | 0.56 |
| Varanasi | 0.52 |
| Patna | 0.52 |
| Madurai | 0.48 |
| Kochi | 0.30 |
| Total | 31.13 |
Source: MORTH
Divergent Trends on Road Building
As per the table below, there is an overall increase in expenditure on roads & bridges from Rs 25,764 crore in 2007-08 to Rs 36,941 crore in 2010-11.
Table 5: Rising Budgets
| States | 2007-08 | 2008-09 | 2009-10 | 2010-11 | ||||
| Approved outlay | Expenditure | Approved outlay | Expenditure | Approved outlay | Expenditure | Approved outlay | Expenditure | |
| Gujarat | 1,292.02 | 923.67 | 1,626.00 | 1,493.99 | 1,918.50 | 2,320.33 | 2,747.00 | 2,747.00 |
| Maharashtra | 1,430.96 | 1,473.15 | 1,786.61 | 1,986.55 | 3,928.02 | 3,370.91 | 3,458.66 | 3,458.66 |
| Tamil Nadu | 2,622.12 | 2,199.52 | 2,006.34 | 2,119.15. | 2,032.76 | 1,994.28 | 2,189.93 | 1,704.62 |
| UP | 3,929.44 | 4,395.35 | 4,804.95 | 5,225.86 | 4,137.65 | 3,535.55 | 3,021.62 | 3,803.31 |
| All India | 25,463.16 | 25,764.48 | 30,213.28 | 31,648.29 | 33,668.82 | 34,497.05 | 35,208.74 | 36941.23 |
(In Rs crore)
Interestingly, while Gujarat and Maharashtra have shown a gradual increase in their expenditure on roads, Uttar Pradesh and Tamil Nadu have reduced their expenditure on road building.
In general, the state of India’s road infrastructure is obviously linked to many other problems like high rate of highway accidents. Better road infrastructure also means easier movement of goods. Keeping pace with increasing number of vehicles on the roads and the aspirations that go with their acquisitions will be a big challenge in years to come.
