India’s Surprising Losers In Urban Sanitation
| Highlights * Industrial townships like Jamshedpur and Rourkela do better than metropolitan cities * 31 million urban households (including slums) have inadequate sanitation facilities * Uttar Pradesh has 4 cities in the bottom 10 list with poor sanitation coverage |
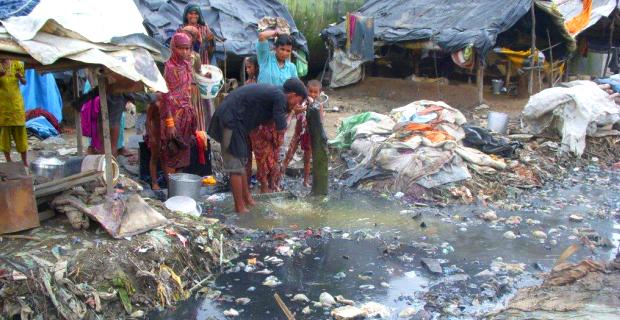
Visitors to India see many faces of urban poverty but find the sheer absence of sanitation perhaps the most striking, more so in urban India. And the numbers are frightening. Some 31 million urban households (including slums) have inadequate sanitation facilities across the country.
The Government has attempted to correct this. It launched the National Urban Sanitation Policy (NUSP) in October 2008 with the stated objective of ensuring that “Indian towns and cities become totally sanitised, healthy and liveable... with a special focus on hygienic and affordable sanitation facilities for the urban poor and women”. The NUSP is run by the Ministry of Urban Development.
But the results are mixed. Efforts to provide better sanitation have worked very well in some cities and not at all in others. Some of the findings of an exhaustive AC Nielsen survey are surprising but others are not. Mumbai and Kolkata live up to the general perception of not being clean cities. And yet, Mumbai is economically better off. So are other cities and towns which score badly. The winners are smaller cities, which perhaps have more effective and committed civic bodies.
Now, the Ministry of Rural Development also runs a different programme, Nirmal Bharat Abhiyan (NBA), which plans to achieve 100% sanitation accessibility in rural India by 2020.
The NBA has 17% all-India achievement rate as of September 2012 in terms of household access to sanitation facilities. While NUSP (run by Ministry of Urban Development) focuses on the urban population (cities, towns and slums), NBA is focussed on rural India.
Let’s return to urban India. Here are some broad numbers. Only 20 of 423 cities surveyed by research firm AC Nielsen and the Centre For Environment Planning Technology & Development Research Services in 2010 for the Ministry of Urban Development crossed the benchmark of 50 out of a total of 100 based on various parameters like output, process and outcome.
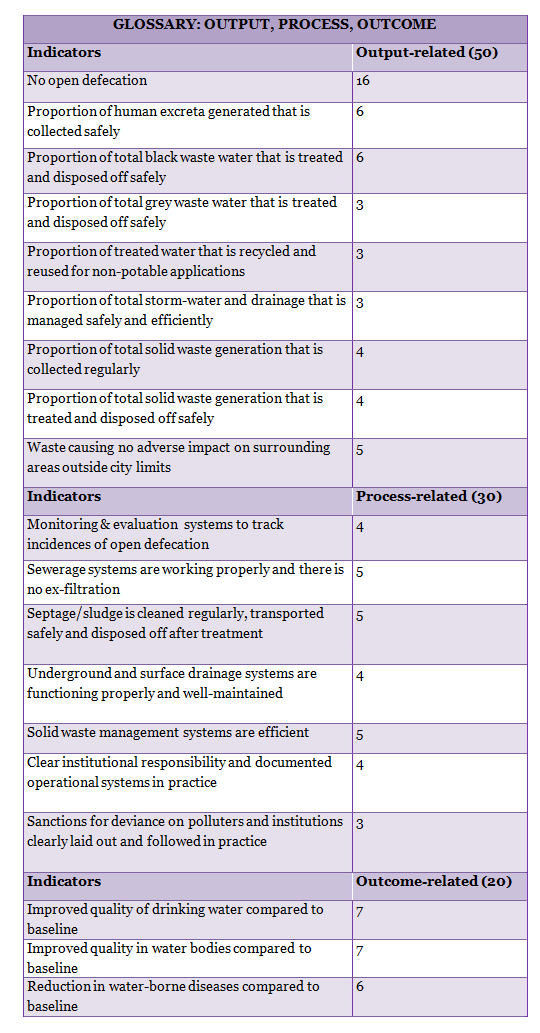
So what do output, process and outcome mean? Output parameters are based on no open defecation, proper treatment of waste water and waste disposal that would cause no adverse effect. Process indicators are based on monitoring and evaluation, regular functioning of sewerage systems while outcome is measured on reduction of water-borne diseases and improved quality of drinking water (See box)
A total of 100 mean complete access to sanitation facilities for all citizens including an improvement in the quality of drinking water and reduction in water-borne diseases.
The top 3 positions in every zone are occupied by developed metropolitan regions. And yet, perhaps not surprisingly, Mumbai is missing from the list.
While southern and western zones are doing the best (especially Karnataka and Gujarat), industrial townships like Jamshedpur and Rourkela do better than even a few metropolitan cities. The data also seems to suggest that less developed, smaller municipality towns with smaller areas are doing badly as compared to the bigger, developed and industrial towns.
Before we look at the city-wise numbers, we need to remember that slums are also part of the NUSP. The total number of households in slums across cities is 14 million of which 9 million have access to sanitation facilities.
So, of the 5 million households who lack direct access, 2 million families use public latrines while open defecation is the only hope for 2.6 million households. Overall, 31 million urban households (including slums) have inadequate sanitation facility in cities across the country.
The following table gives an idea of the top 10 cities and the worst 10 cities as per the latest data available with the Ministry of Urban Development. The ranking is more like a score card given by the government based on a total of 100 points split between output (50), process (30) and outcome (20). (See Box For Details)
Figure 1 (a)
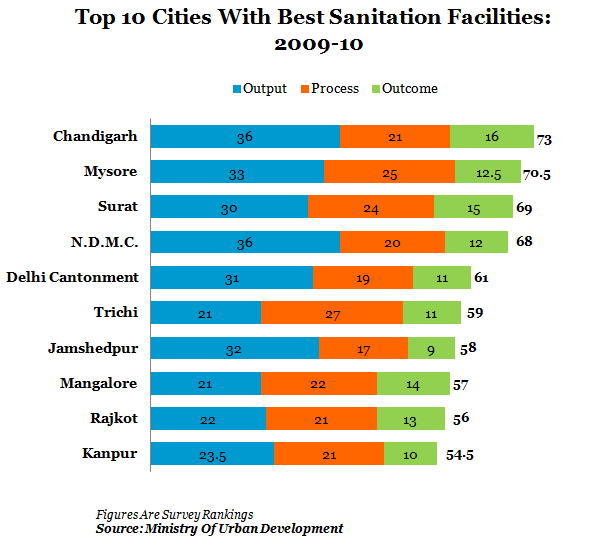
Figure 1 (b)
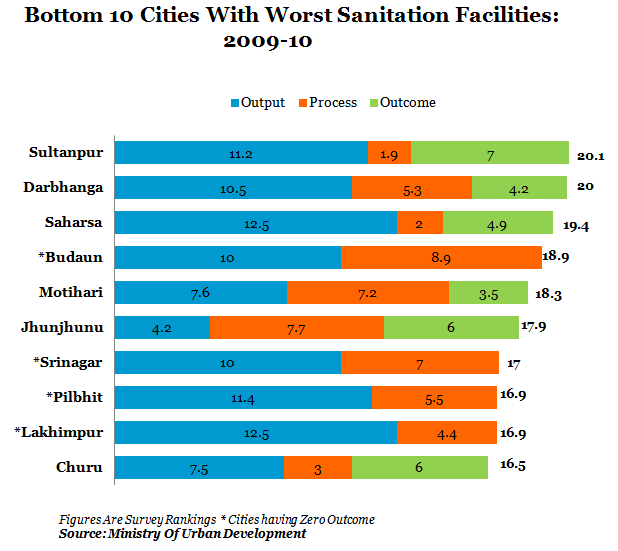
The cities mostly score poorly in process-related and outcome-related issues. While Chandigarh tops the list with a score of 73 points, Churu in Rajasthan is at the bottom of the list with a score of 16.5 points.
No clear trend is seen among the top 10 cities as they are from different parts of the country. However, we can see that Uttar Pradesh has the maximum (4) in the bottom 10 cities followed by Bihar with 3 cities. At least 4 cities in the bottom score 0 in their outcomes.
Let us now divide the cities into regions and see which regions score the best and which are the top 3 and bottom 3 cities in each region:
Figure 2 (a)
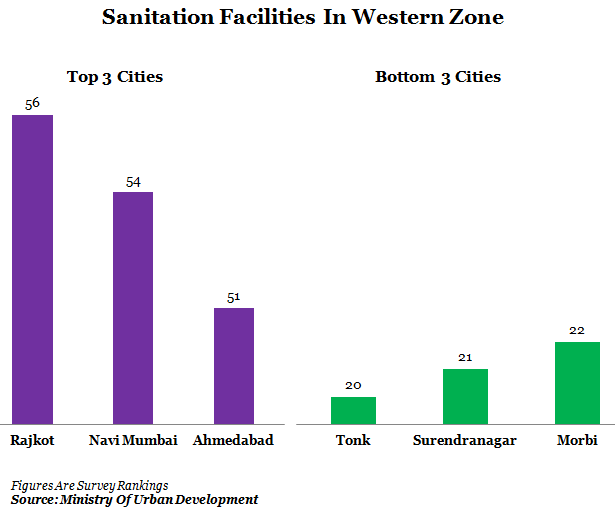
Figure 2 (b)
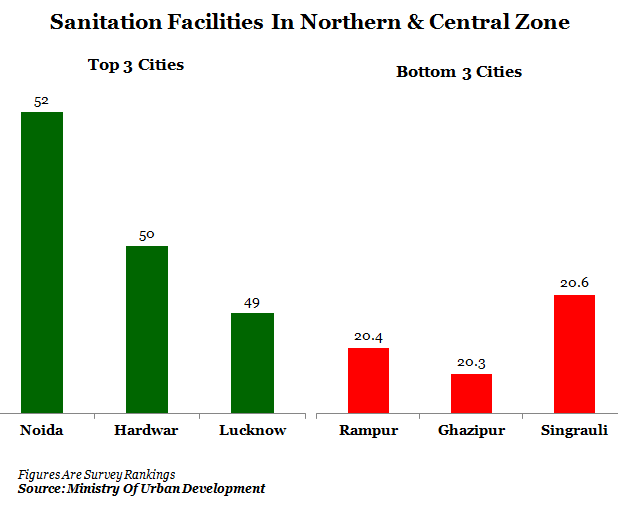
Figure 2 (c)
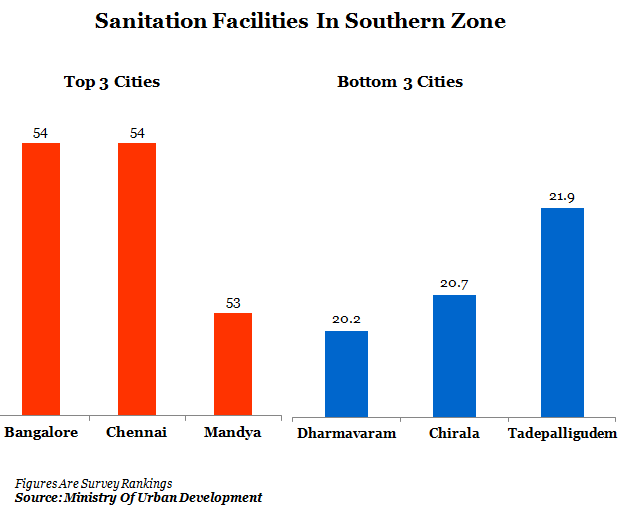
Figure 2 (d)
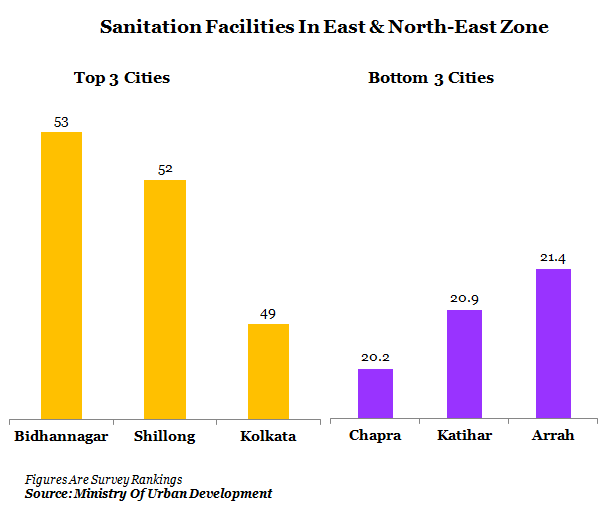
The top 3 positions in every zone are occupied by the developed metropolitan regions. Navi Mumbai and Noida are recently developed zones. Mumbai as we said is missing from the list.
The cities of Uttar Pradesh figure in both best as well as the worst cities in the North zone and one reason is perhaps the large size of the state. Karnataka comes out as the cleanest state in the South zone.
So, only around 20 of the 423 cities surveyed have crossed the benchmark of 50 out of a total of 100. The United Nation’s Millennium Development Goals (MDG) asks the signatory nations to provide improved sanitation to at least half its urban population by 2015 and 100% access by 2025.
The data presented here talks about the scenario till 2010 but providing 100% access to all 420+ cities by 2025 is a tough task... and it is doubtful whether even half of the urban population of India (around 190 million) will achieve the desired sanitation coverage by 2015.