India’s Fastest Growing Crime: Kidnapping Of Women & Girls
| Highlights * Crimes against women registered a 69% decadal jump * Total number of crimes fell 3% from 2011 to 2012, but rose 9% from 2002 to 2012 * Uttar Pradesh, Tamil Nadu, Kerala, Gujarat & Maharashtra recorded the highest number of crimes |
The recent spate of crimes against women has also triggered a sharper analysis of historical data, particularly in the public domain. And the numbers, reported as they are, continue to surprise.
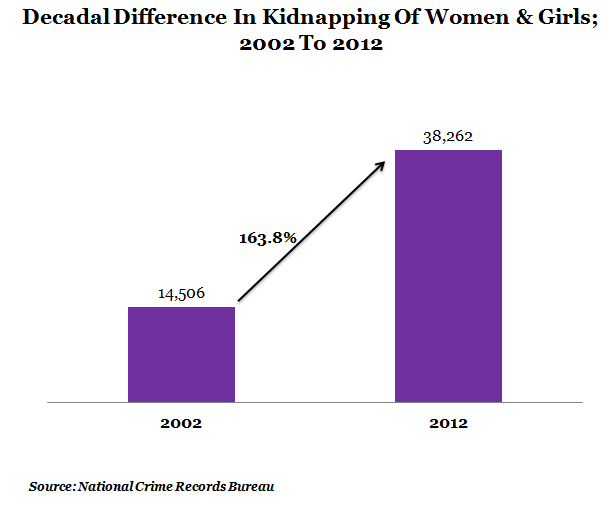
Data released by the National Crime Records Bureau (NCRB) this week shows a 69% decadal (over the decade) jump in crimes against women. The number of kidnappings and abductions of women and girls have jumped a whopping 163.8% since 2002.
Violent crimes or crimes that fall under the Indian Penal Code (IPC) have jumped about 34% over the last 10 years, from about 1.7 million in 2002 to 2.4 million in 2012. On an annual basis, violent crimes rose 3% from the previous year’s 2.3 million.
The only comfort perhaps lies in the annual data, particularly over the last two years which suggests a 3% overall drop in total number of crimes between 2011 and 2012. But on the other hand, crimes against women registered a 6.3% increase since 2011.
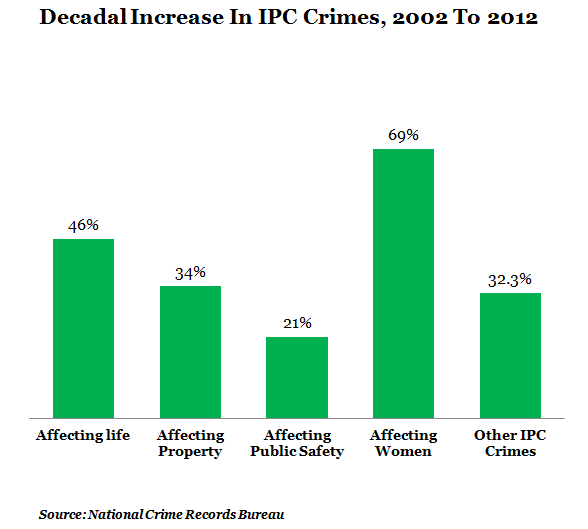
Of all the categories under IPC crimes, crimes against women recorded the highest decadal jump of 69%, from 109,784 in 2002 to 186,033 in 2012. The largest component of this category was cruelty by husbands and relatives, where 49,237 cases were recorded in 2002 and 106,527 cases were reported in 2012.
The incidence of rapes increased by about 52.2%, where 16,373 cases were reported in 2002 and 24,923 cases were reported in 2012.
Kidnapping and abduction of women and girls incidentally saw a 163.8% increase from 14,506 cases in 2002 to 38,262 cases in 2012.
Figure 1
The graph below gives us a better idea of the increase in crimes from 2002 to 2012.
Figure 2 (a)
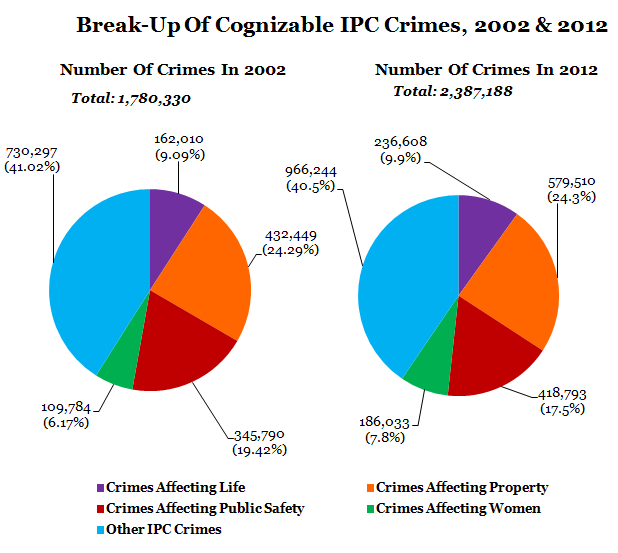
Figure 2 (b)
If one were to look solely at the year 2012, crimes against property took up the largest share in the IPC pie, recording about 579,510 cases or 24.3% of the total IPC crimes. This is just about per cent higher than the 572,604 reported in 2011.
Theft accounted for the highest number of cases under this category with 337,407 cases being recorded. Out of these, 154,351 cases were auto-related.
Crimes affecting public safety; which include arson, riots etc., had the second largest share in the IPC crimes, recording about 418,793 cases which constituted 17.5% of the IPC crimes. This is a 10% jump from the 380,411 cases reported in 2011.
As you can see from above, there were about 236,608 crimes affecting life that were recorded in 2012. This is an increase of 2% from 2011. Out of these, murder accounted for 34,434 of the cases.
Total Number of Crimes [IPC+SLL]
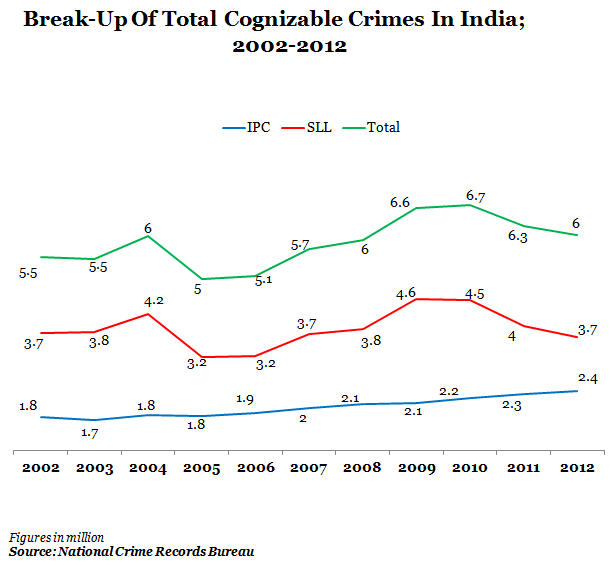
The total number of crimes in the country has increased almost 23% over the last decade. However, data released by the NCRB shows that there has been an overall drop in the total number of crimes in 2012 by about 3% from 2011.
There were a little over 6 million crimes reported in 2012. About 2.3 million or 39.5% of the total crimes fell under the IPC (Indian Penal Code). The IPC cases mostly deal with violent crimes like murder, rape, kidnapping and theft.
A little over 3.5 million crimes came under the SLL (Special & Local Laws) category which constituted about 60% of the total crimes. SLL cases mostly deal with narcotics, arms, gambling, and dowry & sati prevention to mention a few.
The figure below shows the breakup of the total cognizable crimes in India from 2002 to 2012.
Figure 3
#Cognizable: Look
As you can see from above, in 2012 a little over 6 million serious crimes were committed, about 3 % less than the 6.2 million crimes recorded the previous year, 2011. However if one were to look at the figures for the past decade, it can be seen that there is an increase of 9.2% from the 5.5 million crimes recorded in 2002.
The SLL crimes recorded a decadal decrease of 2.5%, while they showed an almost 7% fall from the previous year.
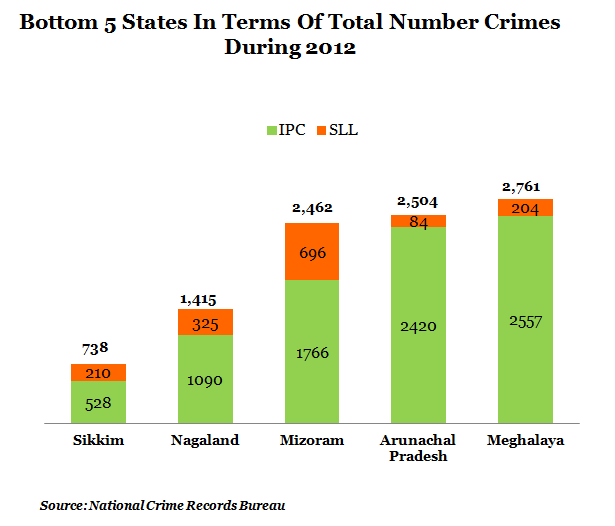
Most Dangerous States
The report revealed that Uttar Pradesh, Tamil Nadu, Kerala, Gujarat and Maharashtra are the most crime-prone states, which include both IPC and SLL. The north-eastern states of Sikkim, Nagaland, Mizoram, Arunachal Pradesh and Meghalaya were among those with the lowest number of crimes reported.
The figure below gives us a break-up of the types of crimes in the Top 5 and Bottom 5 states.
Figure 4 (a)
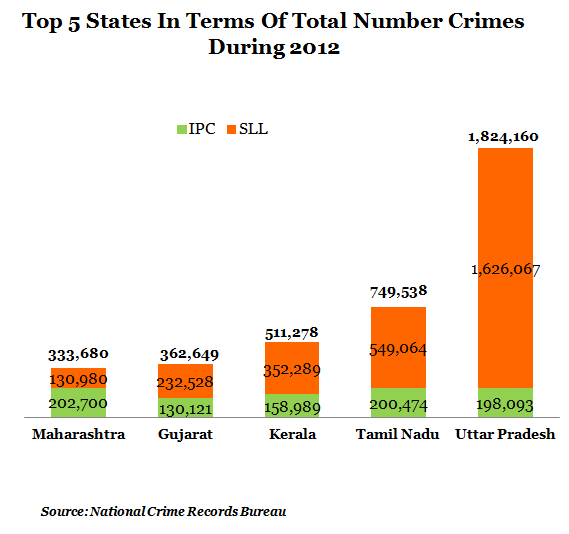
Figure 4 (b)
Another interesting point to note is that, while it wasn’t in the Top 5 states, Madhya Pradesh recorded the highest number of IPC crimes at 220,335.
While the data does show that there has been an increase in the number of crimes, it must also be kept in mind that it is possible that the reporting of crimes has increased over the past decade.
Glossary:
*Cognizable Offence: Officer in charge can investigate and arrest without a warrant; classified into IPC & SLL crimes
Non-Cognizable Crimes: Cannot be investigated by police without a warrant
IPC: Indian Penal Code. Includes crimes like murder, kidnapping, rape, dowry deaths, cruelty by husband & relatives, molestation, sexual harassment, importation of girls, child rape, infanticide, foeticide, abetment to suicide, theft, Dacoity, arson. Riots, cheating, counterfeiting
SLL: Special & Local Laws. Includes crimes like narcotics, gambling, arms, dowry, sati prevention
