India Still Has 269 Million Poor, Bihar Leads Race In Reducing Poverty
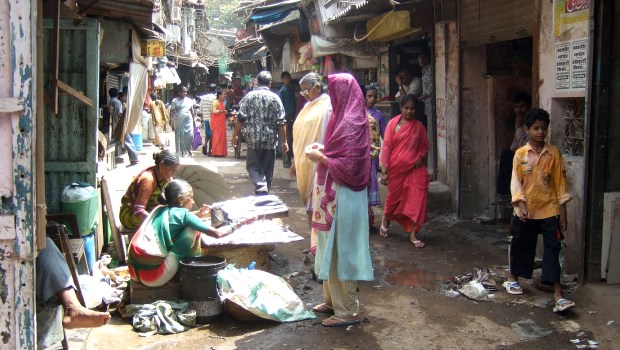
| Highlights * Number of people below the poverty line in India has declined from 407.1 million in 2004-05 to 269.3 million in 2011-12 * Most of the reduction was in rural areas where people below the poverty line declined from 328.6 million in 2004-05 to 216.5 million in 2011-12 * For a family of five, the all-India poverty line, in terms of consumption expenditure, would be about Rs 4,080 per month in rural areas and Rs 5,000 per month in urban areas |
One way of framing the question is to ask whether the present United Progressive Alliance (UPA) Government’s inclusive programmes are yielding results? The other is to ask what would have happened if India had not grown at 7.47% for 8 years.
The other point to note is the role of states in driving the broad data. Bihar and Orissa (IndiaSpend has reported this earlier too) have clearly managed to bring down poverty in their states. Until the most recent figures were released, Orissa had the best track record in poverty alleviation in the past decade.
Now there is also a possibility that - given the sudden variations - that some of the estimates and numbers will be questioned or revisited. For instance, the one-year jumps (2009-10 and 2011-12) in poverty reduction in several states is quite sharp. Till then, lets look at the data at hand. The headline clearly lies here: Planning Commission’s recent poverty estimates show that the number of people below the poverty line has come down from 407.1 million in 2004-05 to 269.3 million in 2011-12.
Figure 1 (a)
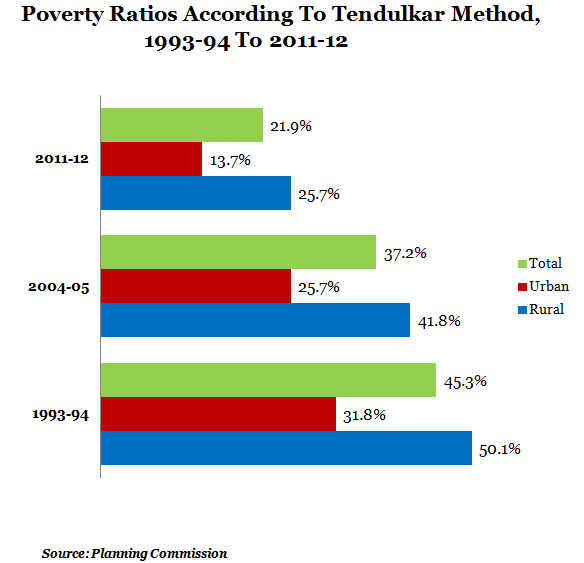
Figure 1 (b)
(Figures 1 (a) & (b) show the national level poverty ratio based on comparable methodology (Tendulkar Method) for 1993-94, 2004-05 and 2011-12 estimated from survey of household consumer expenditure data of 50th, 61st and 68th round, respectively).
The poverty ratio has declined from 45.3% to 21.9% between 1993-94 and 2011-12. The annual average decline in poverty was 0.74% between 1993-94 and 2004-05, and this rate increased to 2.18% from 2004-05 to 2011-12. It can also be seen that most of the annual average decline of poverty between 2004-05 and 2011-12 was due to a decline in poverty in the rural areas.
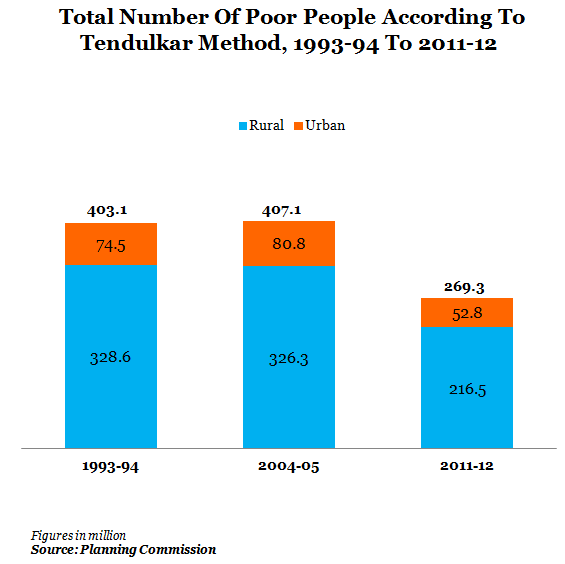
There was a 33% decrease in the number of poor from 403.7 million to 269.3 million from 1993-94 to 2011-12. Most of the poverty reduction was due to people coming out of poverty in rural areas where the numbers reduced from 328.6 million to 216.5 million during the same period.
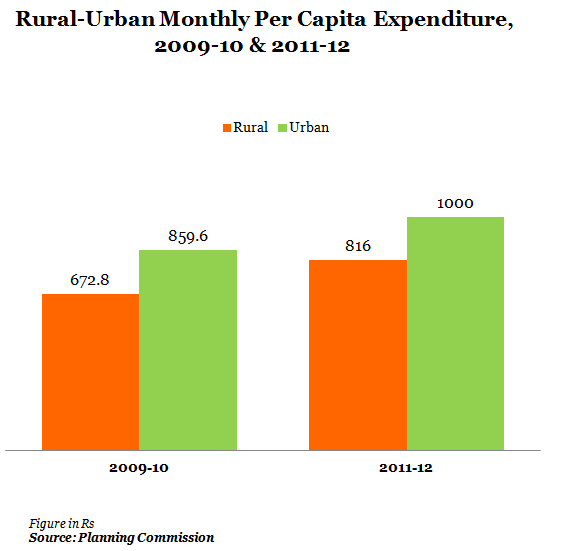
The national poverty line using the Tendulkar methodology is estimated at Rs 816 per capita per month and Rs 1,000 per capita per month in urban areas for 2011-12, according to the Planning Commission. For example, for a family of five, the all-India poverty line in terms of consumption expenditure would be about Rs 4,080 per month in rural areas and Rs 5,000 per month in urban areas.
Numbers-wise reduction in poor people
Although the percentages look good, let us now look at the state-wise numbers of people out of poverty. The following table shows the number and percentage of people below poverty line between 2009-10 and 2011-12. We've also looked at the top five states in each category:
Figure 2 (a)
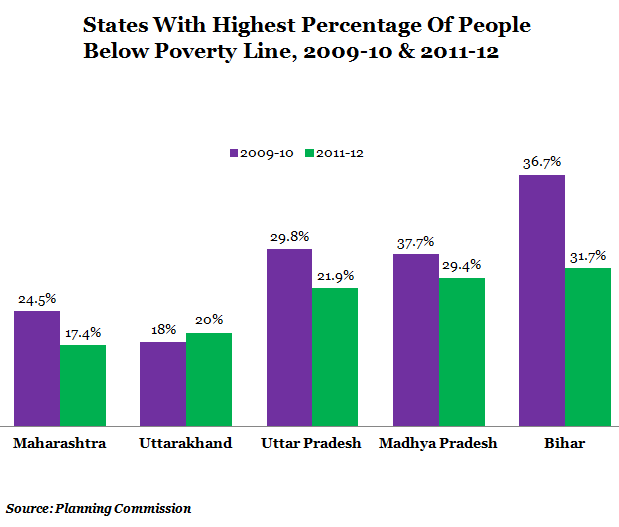
Figure 2 (b)
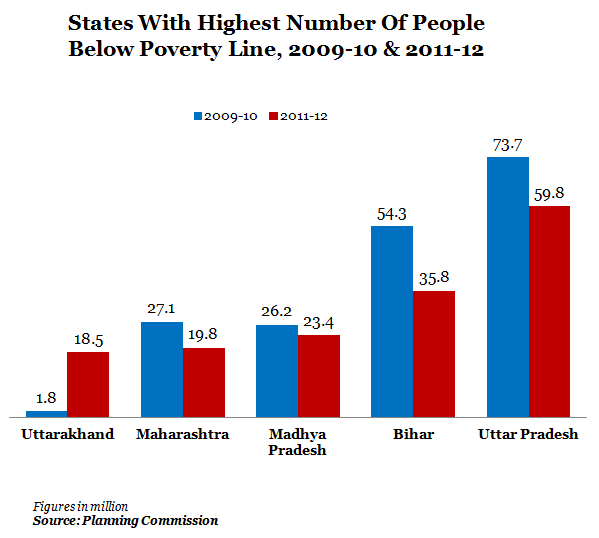
It can be seen from the 9% decline in poverty in 2009-10 and 2011-12 that 85 million people have come out of poverty. The highest decline was seen in Bihar with the number of poor people reducing from 54.3 million in 2009-10 to 35.8 million in 2011-12, which means 18 million people have been pulled out of poverty.
Disparity of incomes
Even though all this is good news, we need to look deeper at another story that is emerging, which is the growing disparity in urban and rural areas. Based on the monthly per capita consumption expenditure (MPCE), it can be seen that the rural-urban expenditure gap continues to remain high:
Figure 3
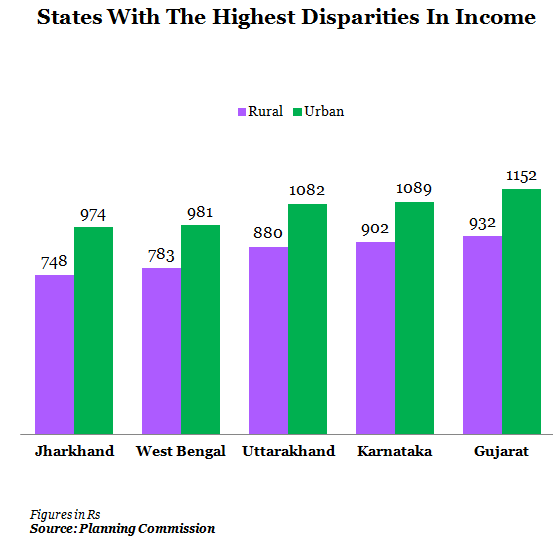
And if we look at the state-wise break up, the scenario is more interesting. The following table shows the top 5 states with highest disparities of income.
Figure 4
Another alarming fact is that the increasing disparity among states in rural and urban areas. The following set of tables show the highest and lowest spending states in both urban and rural areas:
Figure 5 (a)
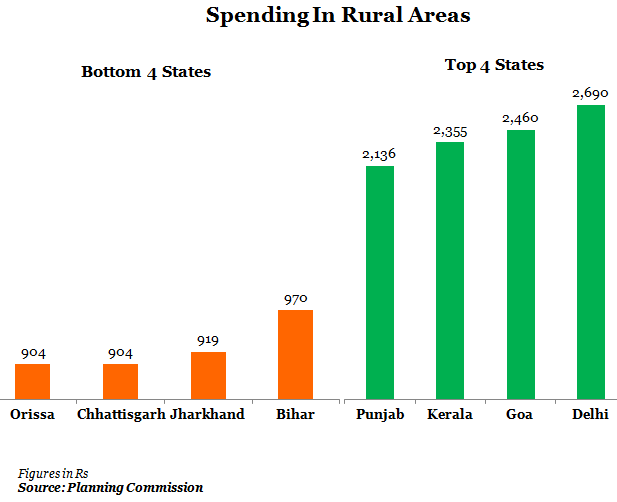
Figure 5 (b)
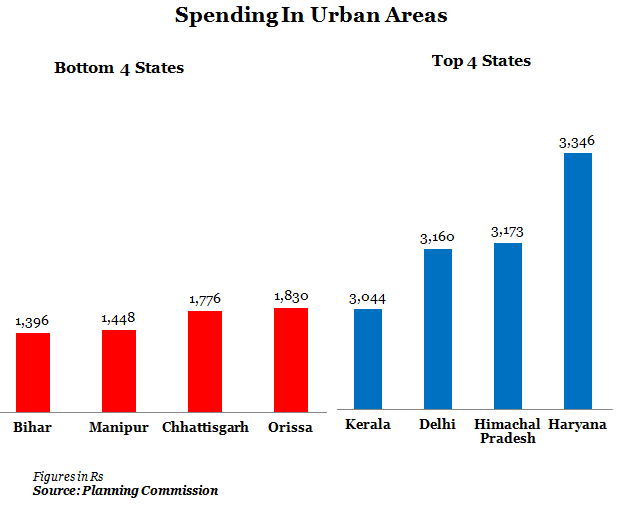
It can be seen that, on an average, a person in rural Orissa spends Rs 904 every month on consumption while an average person in rural Delhi spends Rs2,690. Similarly, on an average, a person in urban Bihar spends Rs 1,396 on consumption while an average person in urban Haryana spends Rs.3,346.
The absolute drop in poverty, while notable, is also driven by high growth. A point also brought out by economists like Surjit Bhalla. The last few years have seen lower growth (6.21 % in 2011-12 & 4.96 % in 2012-13). What this relatively low growth era will do to poverty numbers, rural and urban, remains to be seen.
