India Improves Global Competitiveness But Core Issues Persist
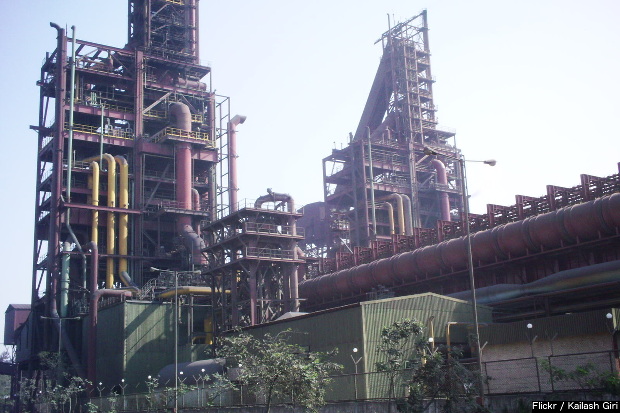
A view of a steel factory in Gujarat. India ranked 39th out of 138 countries in the Global Competitiveness Index. Amongst 12 sub-indicators considered to arrive at the index, India fared worst at technological readiness (110th).
India improved its ranking from 55th of 144 countries to 39th out of 138 countries in one year, but its low scores on health and education remained among the worst in the world, according to the annual Global Competitiveness Report 2016-17 published by the World Economic Forum (WEF) in September 2016.
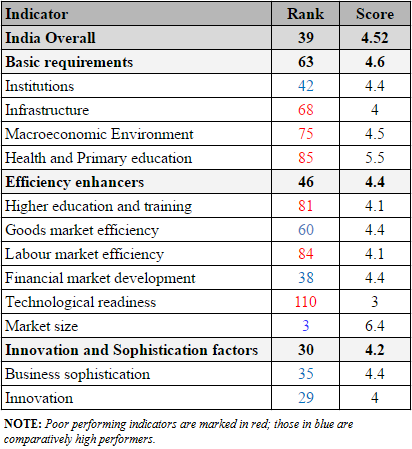
Source: The Global Competitiveness Report 2016-17, World Economic Forum.
The Global Competitiveness Index (GCI) report divides nations based on the stages of growth theory and ranks nations on respective ‘stages’, depending on their gross domestic product (GDP) per capita.
India is placed in Stage 1 of growth, where the basic requirement indicators are considered to be the most important and have the maximum weightage (60%).
India ranks the last in “basic requirements” (63rd) compared to “efficiency enhancers” (46th) and “innovation and sophistication factors” (30th), although its basic requirements score (4.6) is more than those of efficiency enhancers (4.4) and innovation factors (4.2).
This suggests that India lags other nations in basic requirements, especially health and education, which should otherwise form the base of economic competence.
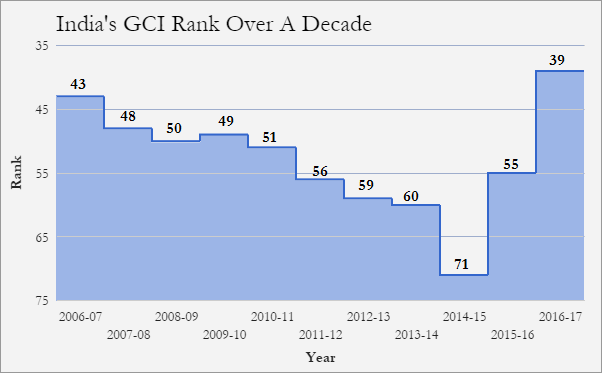
India’s rise in GCI over the past two years
India experienced its lowest score in 10 years in the GCI 2014-15, caused by a reduced confidence in government transparency and institutions. If we consider WEF’s use that year of a sustainability adjusted index, which took into consideration environment and social indicators, the fall would have been sharper—a score of 3.85 and not 4.21. A fall in competitiveness in 2007-08 was caused mainly by high government debt and inflation.
India’s scores have increased from 2014 to 2016.
Source:The Global Competitiveness Report 2016-17, The Global Competitiveness Report 2015-16, The Global Competitiveness Report 2014-15, World Economic Forum.
Reasons for India’s rise in rankings
The improvement in sub-indicators--such as intellectual property rights (IPR) protection, inflation, foreign direct investment (FDI), technology transfer and venture capital availability--corresponds to policy changes, such as IPR Policy 2016, sound monetary policies over the period, further relaxation of FDI norms under Make in India, and the Startup India Policy 2016.
However, attributing the outcomes of these policies to the rise in the index would be premature; they may have contributed to a change in business perception reflected in the Executive Opinion Survey (used to determine the index scores).
The rise in sub-indicators, such as public trust in politicians, business cost of crime and violence, reliability of police services and quality of roads, can be considered perception-based changes.
External causes for the rise include low oil prices and the WEF doing away with sustainability adjustment in the calculation of its indices after 2014.
India’s competitiveness scores up 0.08 since 2006-07
There has not been much of a rise--an improvement of four ranks and a score improvement of 0.08--for India since 2006-07.
Source: The Global Competitiveness Reports 2006-07 to 2016-17, World Economic Forum
Over this period, India has risen only marginally in basic requirements and efficiency enhancers while it has fallen in terms of innovation factors. It has a downward trend in nine of 12 indicators, showing improvement only in macroeconomic environment, infrastructure and market size.
China has a nine-fold lead over India
China has grown by 16.7% in its overall GCI score since 2006-07, compared to India’s growth of 1.8%--a nine-fold lead.
China led India in basic requirements and had a lesser score on efficiency and innovation counts in 2006-07; it now has better scores on all three pillars.
Among the BRICS nations, South Africa, Russia and China are better performers than India in most sub-indicators.
Source: The Global Competitiveness Report 2016-17, The Global Competitiveness Report 2014-15, The Global Competitiveness Report 2010-11, The Global Competitiveness Report 2006-07, World Economic Forum.
Sri Lanka, Nepal and Bangladesh have all registered larger growth in terms of the index since 2006-07 (8.5%, 18.7%, 9.8%, respectively) compared to India, with the exception of Pakistan (-4.6%). Sri Lanka fares better than India in basic requirement scores.

Source: The Global Competitiveness Report 2016-17, The Global Competitiveness Report 2014-15, The Global Competitiveness Report 2010-11, The Global Competitiveness Report 2006-07, World Economic Forum
(Spencer is an intern at IndiaSpend.)
We welcome feedback. Please write to respond@indiaspend.org. We reserve the right to edit responses for language and grammar.
__________________________________________________________________
“Liked this story? Indiaspend.org is a non-profit, and we depend on readers like you to drive our public-interest journalism efforts. Donate Rs 500; Rs 1,000, Rs 2,000.”
