India Has Highest Gap Between Growth Of Top 1% and Entire Population: Study
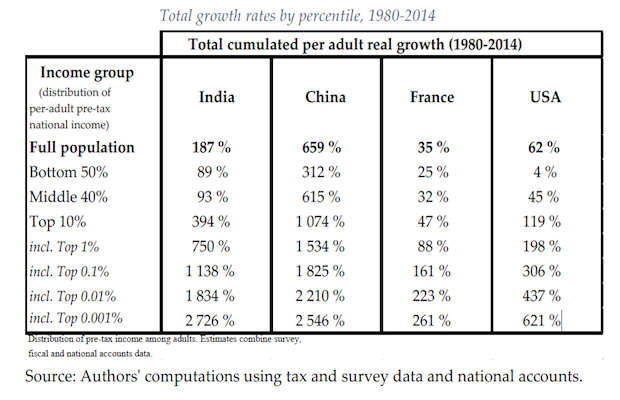
Between 1980 and 2014, India was the country with the highest gap between the growth of the top 1% of the population by income and growth of the full population, according to a recent working paper by Lucas Chancel, a professor at Science Po in Paris, and Thomas Piketty of the Paris-based Ecole des Hautes Etudes en Sciences Sociales.
This rising income inequality--or the difference between the incomes of the poorest and richest--shows the different impact of policies on the rich and poor, and suggests a widening gap between the two economic groups.
This “unequal growth dynamics” between 1980 and 2014 are also seen in China, US and France, the authors wrote. “India's dynamics are, however, striking: it is the country with the highest gap between the growth of the top 1% and growth of the full population.”
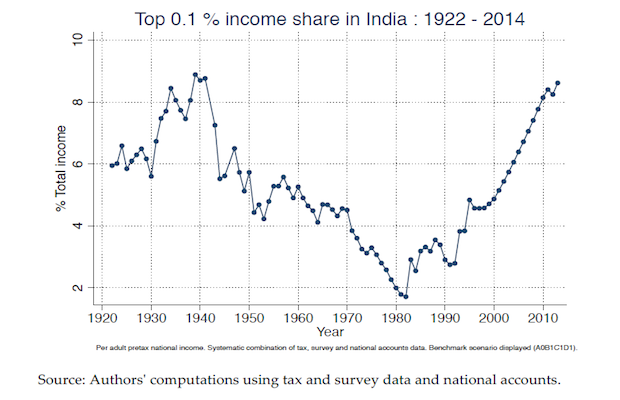
In India, less than 21% of total income of the country belonged to the top 1% of earners in the late 1930s. This share dropped to 6% in the early 1980s and rose to 22% today, found the researchers, who used data from the National Sample Survey Office, National Accounts data, tax data, the Indian Human Development Survey (IHDS), and United Nations Population Statistics in the paper.
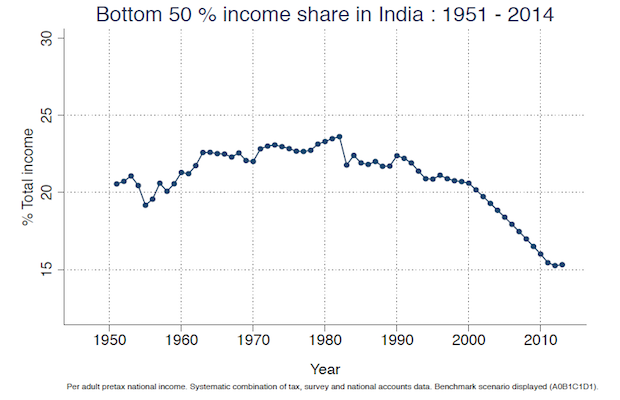
Between 1951 and 1980, 28% of total income of the country belonged to the bottom 50% of the population, and their income grew faster than the average growth of the entire population, the paper found. Income of the top 0.1% decreased between 1951 and 1980.
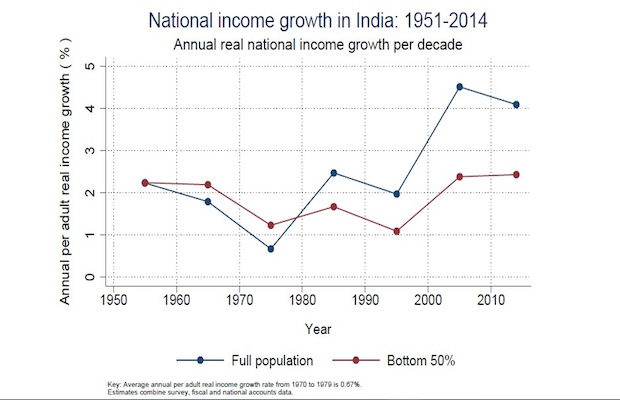
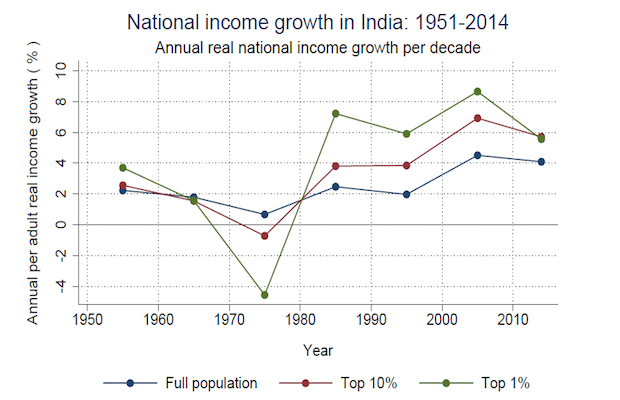
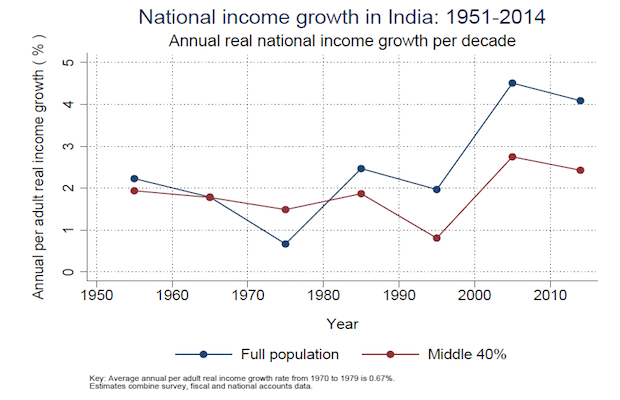
Between 1980 and 2014, the situation was reversed: The top 0.1% of earners had a higher share of total income than the bottom 50% (12% vs 11%), while the top 1% had a higher share than the middle 40% (29% vs 23%), the paper found.
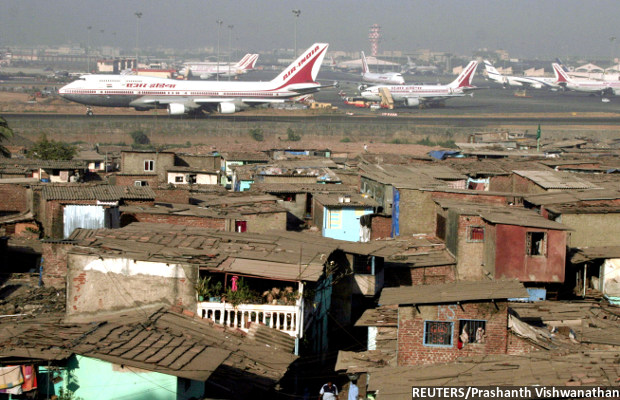
Growing inequality does not mean that more people became poorer, but that the gap between the richest and the poorest grew. Higher growth rates after liberalisation did reduce poverty in India, with the effects greatest in states with initially higher literacy, higher farm productivity, higher rural living standards (relative to urban areas), lower landlessness and lower infant mortality. The proportion of the Indian population living under the poverty line--defined as having an income of $1.90 a day--reduced from 45.9% in 1993 to 21.2% in 2011, Piketty and Chancel noted.
Lack of data to reliably calculate income and inequality in India
Though India gets higher revenue from income tax--equivalent to 2% of gross domestic product (GDP)--than China (1%), this revenue is lower than Brazil, Russia (4%), South Africa, OECD countries (9%).
Further, there has been an increase in the proportion of the Indian population filing tax returns. Up to the 1950s, less than 0.5% of the population filed returns, which rose to about 1% by 1990, 3% in the late 1990s and more than 6% between 2010 and 2014. But the current figure is similar to levels in France and in the USA in the late 1910s, and much lower than the levels observed in the decade after World War II in these countries, the authors wrote.
Even though the study found growing income inequality in India since the 1980s, there is a lack of good quality reliable data on income in India. Tax compliance in India is low, and tax data are not always made public. For instance, the Indian income tax department stopped publishing tax statistics between 2000 and 2011.
“There are two major problems with the use of income tax data (even when available!) for countries like India. The first, widely noted problem is that in India, very few individuals are in the tax net and, of these, only about half pay taxes,” wrote Surjit Bhalla, Chairman and MD of Oxus Investments, a New Delhi-based economic research and advisory firm, in an article in the Indian Express in January 2016. He calculates that tax data will be available for only about 3.5% of workers in India.
Bhalla further posited, based on NSSO consumption expenditure, inequality in India has not worsened in the last 25 years. Inequality in India declined between 1951 and 1983. "For the high-growth period 1983-2005, the pattern is a V shaped one--a small 5 per cent decline in inequality between 1983 and 1994, and a corresponding equal increase over the next decade," he wrote in an article in the Business Standard in June 2013.
“We repeatedly stress that there are strong limitations to available data sources, and that more democratic transparency on income and wealth statistics is highly needed in India. That said, we find that our key results are robust to a large set of alternative assumptions made to address data gaps,” Chancel and Piketty wrote in the paper.
Their paper combined household survey, fiscal and national accounts data to get a better picture of incomes between 1950 and 2014. For the period between 2000 and 2011 for which there are no tax data available, the researchers calculated incomes based on survey data on household consumption from the NSSO and income from the IHDS.
(Shah is a reporter/writer with IndiaSpend.)
We welcome feedback. Please write to respond@indiaspend.org. We reserve the right to edit responses for language and grammar.
__________________________________________________________________
“Liked this story? Indiaspend.org is a non-profit, and we depend on readers like you to drive our public-interest journalism efforts. Donate Rs 500; Rs 1,000, Rs 2,000.”
