India Enrolls More Children In Secondary School, But Is Failing To Teach Them
India has enrolled more children than ever before in secondary schools, but it is failing to teach them what they should be learning, with the most vulnerable, such as students from scheduled tribes, falling further behind the rest, reveal the preliminary findings of an ongoing global study.
The India findings, gleaned from the relatively advanced states of Andhra Pradesh and Telangana, are in line with previous studies that revealed nationwide persistent, learning deficits (here and here).
Conducted in Andhra Pradesh and Telangana in July-August 2016 and February 2017 with 8,355 children in grade IX, the Young Lives longitudinal study is an international investigation across four countries, funded by the University of Oxford, UK.
Among the positives: The share of children aged 15 (the normal age for grade IX if a child started school at age six in grade I) in grade IX rose to 91% in 2016 from 78% in 2009; the share of girls aged 15 enrolled in grade IX was up to 90% in 2016 from 74% in 2009, while the proportion of children from backward classes at that age rose to 91% from 76% over these eight years.
But even as the share of children attending private schools increased marginally to 37% in 2016 from 35% in 2009, private school enrolment remains biased towards upper castes (62%), the richest third (62%) and urban children (64%).
Source: 2016 Young Lives Survey Fact Sheet
The ongoing study has followed 12,000 children in India, Ethiopia, Vietnam and Peru since 1998 and the 2016-17 round is the fifth in the series. Cross-country comparisons are yet to be published, said Renu Singh, Country Director, Young Lives India.
Young Lives followed two cohorts of grade IX students, born seven years apart--the younger cohort turned 15 in 2016 and the older in 2009--to track changes in their education over the period.
Math performance in private schools drops faster than in govt ones
The share of children in grade IX who could answer three math questions--adding with decimals, reading a pie chart and solving a problem--fell by two percentage points to 10% in 2016 from 12% in 2009.
In government schools, the proportion of children answering math questions dropped by 0.7 percentage points to 9% in 2016, in private schools, the share dropped by six percentage points to 14% in 2016.
Average scores in a math test of 31 questions were lowest in government schools (30%) and highest in private schools (41%) in 2016.
| Learning Levels | ||||
| Children answering 3 comparable math questions correctly (2009) | Children answering 3 comparable math questions correctly (2016) | Avg score in math test of 31 questions (2016) | Avg score in vocabulary test (2016) | |
| Gender | ||||
| Male | 16.8 | 11.3 | 34.2 | 84.4 |
| Female | 7.1 | 8.6 | 31.3 | 83.1 |
| Caste | ||||
| Scheduled Castes | 7.3 | 6.8 | 28.6 | 83.6 |
| Scheduled Tribes | 7.2 | 6.9 | 29.1 | 80.8 |
| Backward Classes | 11 | 10 | 32.7 | 83.3 |
| Other Castes | 20.4 | 15.2 | 39.8 | 87.3 |
| Maternal education level | ||||
| None | 9.9 | 6.1 | 27.6 | 81.3 |
| 1 to 5 years | 13.5 | 9.9 | 33.5 | 84.6 |
| 6 to 10 years | 14.7 | 14.3 | 38.3 | 87 |
| More than 10 years | 17.7 | 15.6 | 47 | 88.2 |
| Household wealth level | ||||
| Poorest tercile | 6.2 | 6 | 27.5 | 80.3 |
| Middle tercile | 12.8 | 10.3 | 32.5 | 84.1 |
| Least poor tercile | 16 | 13.8 | 38.5 | 87.2 |
| Location | ||||
| Urban | 14.2 | 13.3 | 37.3 | 86.1 |
| Rural | 11.1 | 9 | 31.4 | 82.8 |
| States – After bifurcation | ||||
| New Andhra Pradesh | 11.9 | 11.6 | 35.3 | 84.6 |
| Telangana | 11.6 | 7.1 | 28.3 | 82.4 |
| Type of school attended | ||||
| Public | 9.7 | 9 | 30 | 83.2 |
| Private | 20.2 | 14 | 40.7 | 87.4 |
| Other | 20 | 16.7 | 33.8 | 89.4 |
| Mixed public private | - | 9.3 | 37.9 | 81.1 |
Source: 2016 Young Lives Survey Fact Sheet
Note: Figures in %
Children from scheduled tribes fail more than the rest
The proportion of overage grade IX students from scheduled tribes--a set of tribes recognised by the Indian constitution as historically disadvantaged and eligible for state support--rose the highest by 9 percentage points between 2009 and 2016 in the Young Lives sample, three times the rise in the sample’s average.
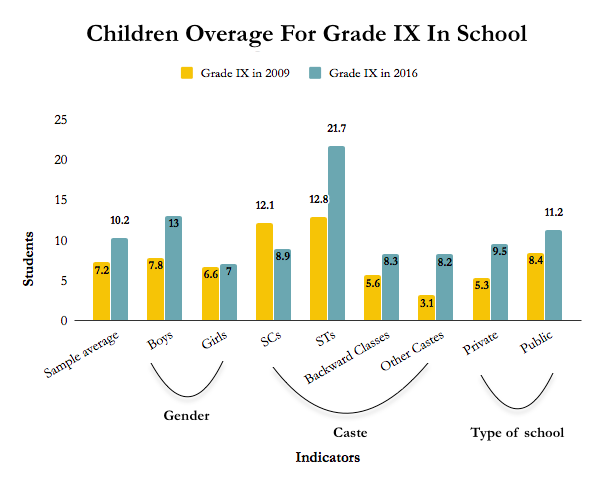
Source: 2016 Young Lives Survey Fact Sheet
The highest proportion of students reporting their homework was checked by teachers were from private unaided schools.
Source: Young Lives School Survey 2016-17: India
(Vivek is an analyst with IndiaSpend.)
We welcome feedback. Please write to respond@indiaspend.org. We reserve the right to edit responses for language and grammar.
__________________________________________________________________
“Liked this story? Indiaspend.org is a non-profit, and we depend on readers like you to drive our public-interest journalism efforts. Donate Rs 500; Rs 1,000, Rs 2,000.”
