In 2016, Only 1 In 4 Indians Had Planned For Retirement
By 2031, the population of people more than 65 years old is expected to grow the fastest (75%) among all age groups, yet only 23% were saving or planning to save for retirement in 2016, according to an August 2017 report of a committee on household finance set up by the Reserve Bank of India (RBI), India’s central bank.
Only 60% insurance policies received premium for the second year in 2016, the RBI report data show. In five years to 2016, the average number of policies that got second-year premium dropped to 58%. Only 29% policies received payment for the fifth year in 2016.
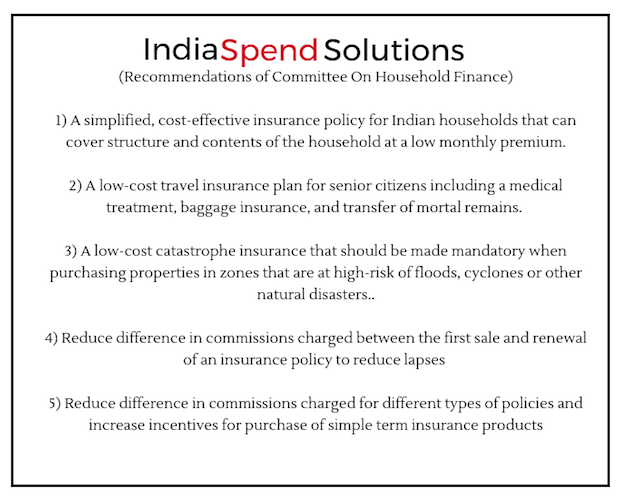
The committee was set up by RBI in April 2016 under the chairmanship of Tarun Ramadorai, professor of financial economics at London’s Imperial College, and had representation from all financial sector regulators.
As they grow old, Indians are not insuring themselves against rising health expenditures. The monthly per capita health spending of elderly households (with all members at least 60 years old) in India is 3.8 times higher than that of non-elderly households (no member above 60 years), according to this 2013 report research by Sanjay K. Mohanty (International Institute for Population Sciences, Mumbai), Rajesh K. Chauhan (University of Lucknow), Sumit Mazumdar (Institute for Human Development, New Delhi) and Akanksha Srivastava (International Institute for Population Sciences, Mumbai).
While health spending accounts for 13% of total consumption expenditure for elderly households, it was 7% among households with elderly and non-elderly members and 5% among non-elderly households.
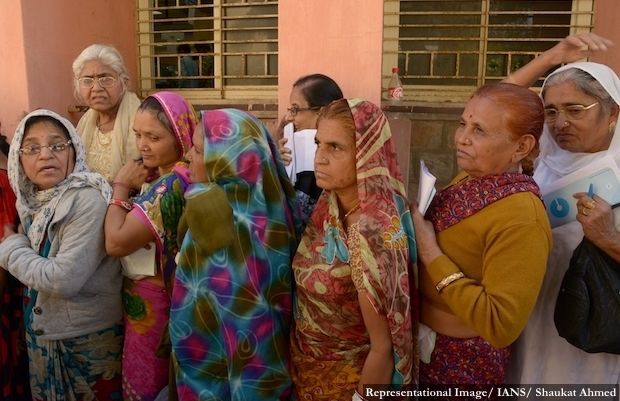
India had 77 people over age 60 per 1,000 population in rural areas and 81 in urban areas, according to the 71st round of the National Sample Survey (NSSO), India’s official socio-economic survey, between January and June 2014.
Source: National Sample Survey 71st Round 2014
In rural areas, 82% people above 60 were dependent on children for economic support while 80% were supported by children in urban areas, according to the NSSO report.
Even in 2031, over 50% Indians above age 65 are seen depending on children instead of their own wealth--which is likely to increase in real estate, the RBI report forecasts.
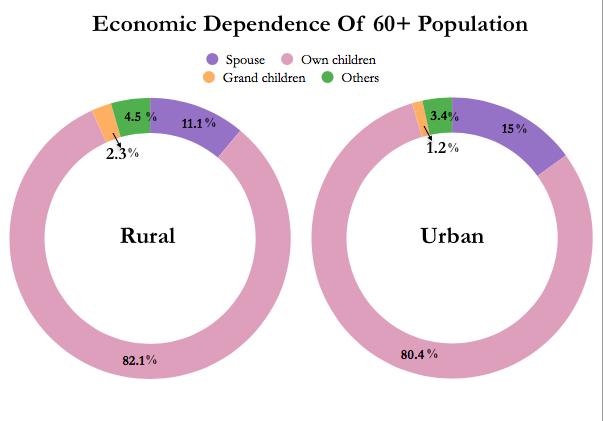
Source: National Sample Survey 71st round 2014
High premium was the biggest reason why people avoided buying insurance with 51% households saying they did not have insurance as they couldn’t afford it in 2015, according to the RBI report.
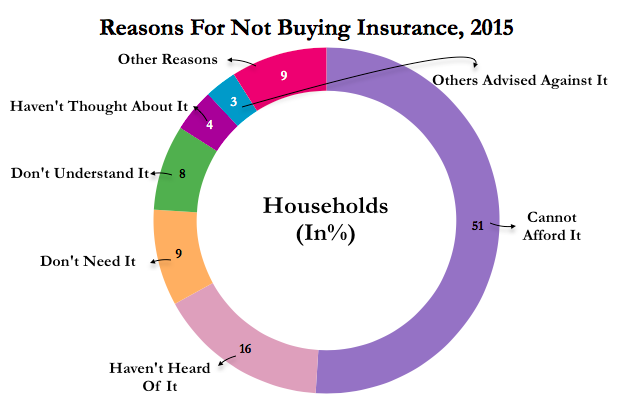
Source: Report of the Household Finance Committee 2017
Nearly 50% customers of the National Pension Scheme--launched for workers in the unorganised sector in September 2010 -- failed to contribute the required Rs 1,000 over a year to obtain incentives in the scheme, although they continue to make smaller contributions, according to a study by economists at Delhi’s Indian Statistical Institute and Mumbai’s Indira Gandhi Institute Of Development Research, cited in the RBI report.
Only 65% Indian households headed by person younger than 35 years hold any financial assets, the RBI report data show. This increases to 77% households headed by person younger than 54 years.
Only 5% Indians Invest Over 10% In Financial Assets
Indians across income classes still prefer land and gold for parking their savings with only Daman & Diu, Sikkim and Dadra & Nagar Haveli--covering 5% of India’s population--saving more than a tenth of their wealth in financial assets, the RBI report data show.
| How Indians Save Wealth Across States, 2012 | ||||||||
|---|---|---|---|---|---|---|---|---|
| Wealth Share Across Assets | Debt Share Across Products | |||||||
| Real Estate | Gold | Financial Assets | Retirement Accounts | Mortgage Debt | Gold Loans | Unsecured Debt | Non-Insti Debt | |
| Daman & Diu | 48.00% | 24.40% | 11.80% | 10.80% | 5.00% | 0.00% | 69.10% | 66.90% |
| Sikkim | 55.60% | 14.60% | 11.60% | 10.30% | 27.00% | 0.00% | 48.20% | 17.80% |
| D & Nagar Haveli | 62.80% | 6.50% | 10.50% | 12.40% | 52.70% | 2.40% | 34.60% | 31.30% |
| Delhi | 54.90% | 17.40% | 9.80% | 6.20% | 15.60% | 0.40% | 63.90% | 46.60% |
| Arunachal Pradesh | 63.30% | 5.10% | 8.30% | 5.00% | 18.10% | 1.30% | 33.30% | 45.70% |
| Chandigarh | 57.00% | 10.20% | 8.30% | 14.10% | 47.10% | 0.00% | 23.00% | 9.50% |
| Puducherry | 56.90% | 25.70% | 7.20% | 4.50% | 3.40% | 50.10% | 33.30% | 40.20% |
| Himachal Pradesh | 71.80% | 13.60% | 6.80% | 3.50% | 35.60% | 0.00% | 42.40% | 35.10% |
| Andaman & Nicobar Islands | 42.50% | 23.50% | 6.30% | 18.10% | 6.40% | 13.10% | 66.40% | 36.20% |
| Assam | 76.10% | 6.60% | 5.30% | 2.60% | 15.80% | 1.20% | 62.90% | 48.00% |
| Karnataka | 67.10% | 16.10% | 5.00% | 4.40% | 24.80% | 3.40% | 53.80% | 49.20% |
| Mizoram | 79.60% | 1.20% | 5.00% | 5.70% | 40.70% | 0.00% | 34.00% | 17.20% |
| Meghalaya | 80.70% | 3.00% | 4.30% | 3.50% | 2.30% | 0.20% | 74.00% | 24.70% |
| West Bengal | 81.20% | 6.70% | 4.00% | 3.30% | 16.70% | 2.80% | 69.50% | 47.40% |
| Andhra Pradesh | 62.80% | 21.60% | 3.80% | 3.10% | 9.50% | 9.50% | 55.30% | 48.90% |
| Goa | 60.00% | 20.20% | 3.70% | 6.00% | 18.10% | 3.50% | 19.00% | 8.00% |
| Haryana | 81.10% | 5.90% | 3.40% | 3.00% | 27.80% | 0.00% | 53.20% | 48.10% |
| Maharashtra | 76.60% | 10.40% | 3.10% | 3.60% | 47.00% | 1.40% | 36.00% | 27.90% |
| Punjab | 81.60% | 4.90% | 3.10% | 4.50% | 25.70% | 2.10% | 57.40% | 57.70% |
| Tamil Nadu | 59.40% | 28.30% | 3.10% | 3.20% | 11.30% | 41.30% | 37.90% | 42.10% |
| Tripura | 76.50% | 10.00% | 3.00% | 3.80% | 3.80% | 0.20% | 72.70% | 44.70% |
| Jammu & Kashmir | 84.20% | 4.70% | 2.90% | 3.10% | 10.10% | 0.00% | 62.20% | 56.30% |
| Kerala | 78.90% | 13.10% | 2.80% | 1.80% | 38.30% | 17.20% | 31.60% | 20.00% |
| Chhattisgarh | 81.70% | 6.80% | 2.70% | 1.10% | 14.70% | 0.20% | 65.20% | 54.30% |
| Jharkhand | 85.60% | 4.40% | 2.50% | 1.90% | 12.90% | 0.20% | 79.70% | 62.80% |
| Lakshadweep | 80.40% | 11.20% | 2.50% | 3.10% | 9.70% | 9.30% | 66.70% | 24.20% |
| Uttarakhand | 78.70% | 10.00% | 2.20% | 2.20% | 18.80% | 0.00% | 67.60% | 45.40% |
| Gujarat | 72.50% | 13.70% | 2.10% | 3.50% | 38.00% | 2.80% | 38.20% | 39.90% |
| Odisha | 78.90% | 10.00% | 2.10% | 2.00% | 26.90% | 2.30% | 59.10% | 47.10% |
| Telengana | 70.50% | 17.50% | 2.00% | 2.40% | 11.30% | 2.90% | 73.00% | 55.80% |
| Madhya Pradesh | 82.20% | 7.40% | 1.90% | 1.70% | 30.40% | 1.00% | 60.00% | 53.60% |
| Uttar Pradesh | 85.40% | 5.60% | 1.80% | 1.50% | 27.30% | 1.30% | 63.00% | 59.20% |
| Manipur | 84.00% | 5.10% | 1.60% | 2.80% | 3.10% | 14.20% | 30.40% | 77.70% |
| Nagaland | 82.60% | 1.60% | 1.50% | 7.30% | 8.00% | 0.00% | 30.80% | 40.30% |
| Rajasthan | 79.40% | 9.50% | 1.40% | 1.70% | 21.30% | 1.00% | 70.20% | 68.70% |
| Bihar | 90.50% | 2.70% | 1.00% | 0.50% | 8.20% | 0.30% | 81.90% | 82.20% |
Source: Report of the Household Finance Committee 2017
An average Indian household holds 77% wealth in real estate, 7% in durable goods like vehicles, livestock and poultry and non-farm business equipment, 11% in gold and 5% in financial instruments like deposits and savings accounts, publicly traded shares, mutual funds, life insurance and retirement accounts.
The debt of most Indian household is unsecured (56%)--that is, without a collateral--reflecting an unusually high reliance on non-institutional sources like moneylenders, according to the RBI report. Unsecured loans account for 23% of total debt in China and 39% in India.
With 95% wealth in non-financial assets, the share of Indian household is identical to the average Thai household and slightly higher than the 91% for Chinese households. The average Chinese household invests 62% wealth in real estate, 28% in durable assets and only 0.4% in gold.
In American households, real estate accounts for 44% wealth, while it is 37% in German households.
(Vivek is an analyst with IndiaSpend.)
We welcome feedback. Please write to respond@indiaspend.org. We reserve the right to edit responses for language and grammar.
__________________________________________________________________
“Liked this story? Indiaspend.org is a non-profit, and we depend on readers like you to drive our public-interest journalism efforts. Donate Rs 500; Rs 1,000, Rs 2,000.”
