How India’s Poorest Take Loans But Donate Liberally
| Highlights * About 2.3% of outflows of the country’s poor people went towards donations & gifts * Water & electricity constitute 1.4% of total outflow, while education constitutes 2.3% * Loans constituted 34%, average debt stood at Rs 5,322 a month & 9 out of 10 households took loans from friends/neighbours/relatives instead of commercial banks |
How do India’s poor manage their finances? On the face of it, this would be a complex question to answer. But the findings of a survey carried out by the Reserve Bank of India (RBI) last month in the southern state of Kerala threw up some interesting insights.
Significantly, the survey found that loans of various sorts form an important chunk of cash or income flow into poor households. Not surprisingly, loan repayments also formed a large part of cash outflows. And while healthcare was the highest non-food consumption expenditure item, even for the poor, donations and gifts formed a part of their lives – an average of 2.3% of outflows. Incidentally, a Mid-Day interview with GiveIndia founder Venkat Krishnan quotes him saying Indians 'give' under 0.3% of their income.
That 2.3% number might sound small but it’s also worth noting that water and electricity are at 1.4% of total outflow, education at 2.3% of total outflow,which in turn is lower than outflow on travel (4.8%), petrol and diesel (2.9%). Subsidies could be one reason for some distortions. By the way, savings with chit fund also form 2.3% of outflows.
The findings may or may not apply uniformly across India because, among other reasons, the RBI survey’s sample is small – it covered 107 households in the district of Ernakulam- in rural areas and Kochi city’s slums. It also looked at household finances in a fixed period of September-October 2012.Its thus possible that a full-year study may have thrown up slightly different results.
Let’s look at the two-month findings in more detail. Salaries & wages account for 61% of total cash inflows followed by loans, which constituted about 34%. Average debt stands at around Rs 5,322 a month(average inflow Rs 15,553) and 9 out of 10 households took loans from friends/neighbours/relatives and not from any commercial banks.
Non-food consumption and non-consumption outflows are the major chunk of a poor household’s expenditure.
The average outflow for loan repayment per month is around Rs 2,470 which is only half the average of the loan taken while 12% of outflows helped build assets.Interestingly, there are three loan transactions per household in the surveyed month and four out five poor households took loans.
The figure below gives the idea of the portfolio choices of sample households;
Figure 1
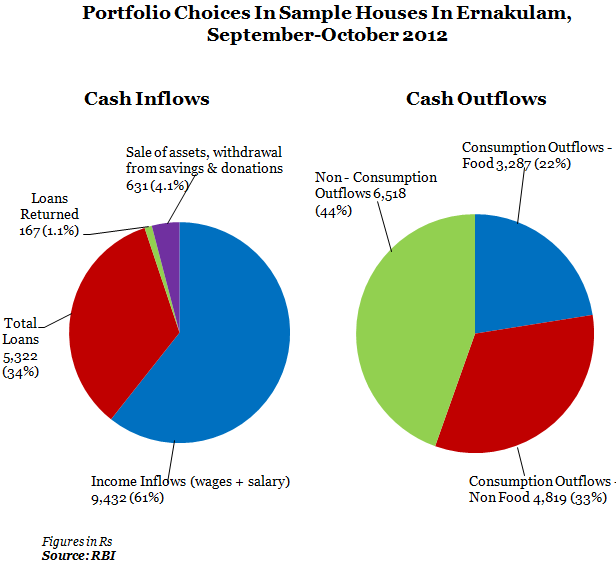
Incidentally, around 84% of cash inflow (Rs 15,553) goes out as expenditure (Rs 14,624). However, if we look at salaries & wages only then there is a shortfall of Rs 5,192 (around 35%) between total outflow and total income inflows.
Let’s look at total loans taken and its sources.
Figure 2
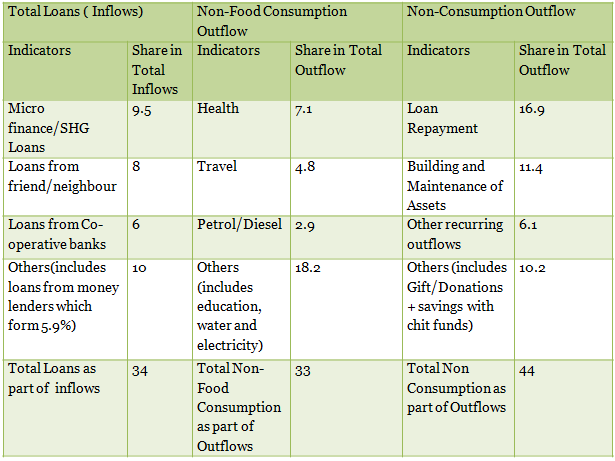
(in %)
*Gift and Donations and savings with chit funds both contribute to 2.3% of non-consumption outflow.
Loans from microfinance and Self-Help Groups (mostly through Kudumbasree, the successful poverty eradication programme) and loans from friends and neighbours form the biggest component of loans taken.
No commercial banks show up in this.This could be because of the sample size or a reflection of a fundamental problem of India’s underbanked– remember, the survey was run by the RBI. Equally, it shows that chit funds, in RBI’s own words, as major financial asses for rural households.
Another important aspect is the spending on health per household which sees the highest outflow. Possibly that’s one reason for Kerala leading India in terms of health indicators.
Why Ernakulam?
Why did RBI use this district of India? Kerala is known to have high levels of overall social development, per-capita state domestic product and per capita consumer expenditure. Moreover, the proportion of poor in Kerala is lowest among major states in India.
Figure 3
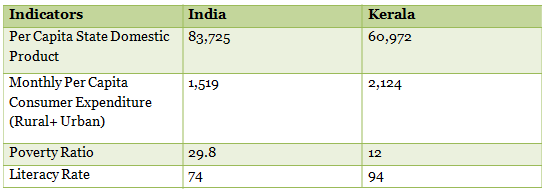
The table clearly shows that Kerala’s figures are ahead of India’s in a few important socio-economic factors. Ernakulam has been used in the study because it was the first district in the country to achieve 100% literacy.
It also has the highest per capita state domestic product in Kerala (Rs 85,070), most houses have latrines, electricity and population coverage per branch of commercial banks in Ernakulam is also better than the whole state.
The RBI sample study may not reflect all India income or expenditure behaviour from an economic standpoint but it might come close. Its quite likely that the larger lessons lie in the social attitudes that govern borrowing on one hand and expenditure patterns, including the desire to give, however small the amount might be. India’s poor might have something to teach India’s burgeoning millionaires.
