How India’s Gender Gap Is Affected By Poor Women’s Health
Here’s the good news. India has improved its ranking in the Global Gender Gap Index released by the World Bank to 101 from 105 among 160 countries.
But that improvement has been driven by something not many would be very impressed with, political participation of women in politics. On the other hand, the big challenge is health. The gender gap would evidently be smaller if women were healthier or had better access to health.
The report does not claim to “capture the complete situation of half the world’s population,” though it does establish a broad list of measures that add up to a rough indicator of gender equity including male- female labour force participation rates, gaps in earned income, male-female literacy rates, sex ratio or babies born in the country (“to capture the phenomenon of ‘missing women’ prevalent in many countries with a strong son preference”), life expectancies for men and women and the representation of women in the highest levels of Government.
Figure 1
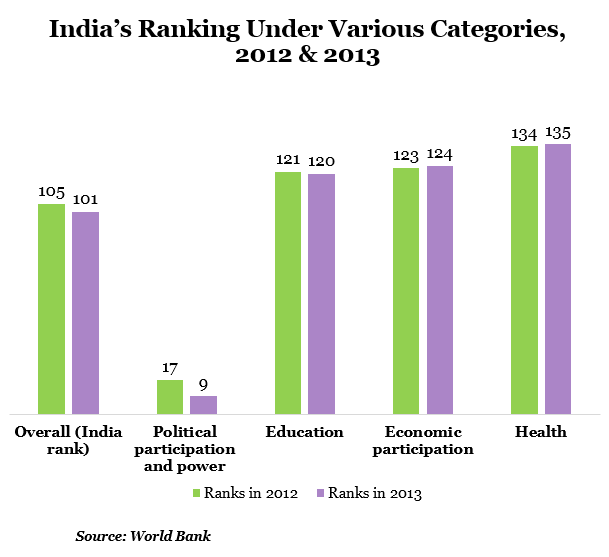
As can be seen from the figure above, India’s overall rank has moved up from 105 in 2012 to 101 in 2013. In 2011, India’s rank was 113. The main improvement in the rank has been due to political participation where India’s rank has improved from 17 in 2012 to 9 in 2013 and a minor improvement in education.
The report says that the persistent gaps in health, education and economic participation can be detrimental to India’s growth. The disproportionate sex ratio at birth has not changed over the past year as observed by the report.
Let us now look at more details in each of the categories:
Figure 2
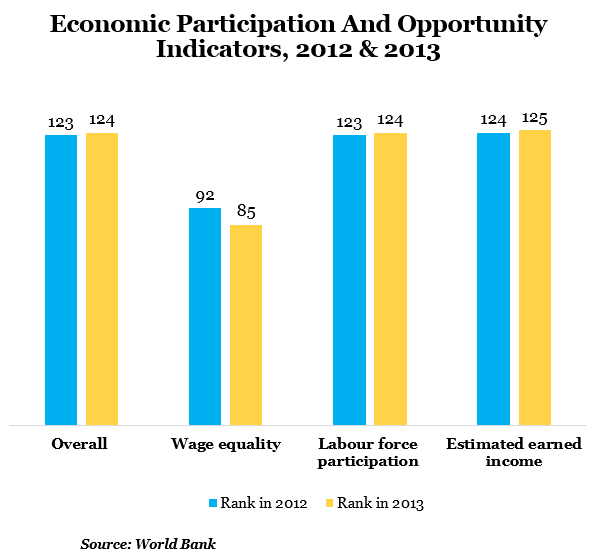
This sub index is captured through three concepts: the participation gap, the remuneration gap and the advancement gap. The participation gap is captured using the difference in labour force participation rate; the rank has gone down from 123 in 2012 to 124 in 2013. The remuneration gap or wage equality is captured through a hard data indicator (ratio of estimated female-to-male earned income), and it has improved from 92 to 85.
A qualitative variable calculated through the World Economic Forum’s Executive Opinion Survey (wage equality for similar work) has gone down to 125 from 124 during the same time period. This sub index shows that labour participation among women has coming down as IndiaSpend had reported earlier. This indicator also shows that there are gender gaps for women who are already active in the labour market.
Figure 3
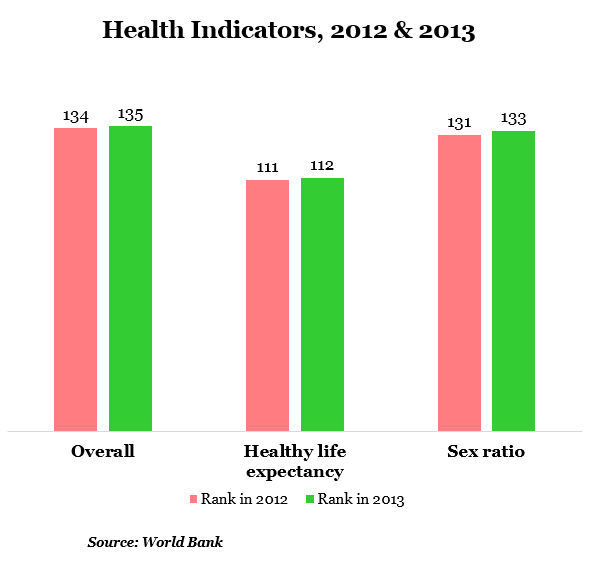
India is still not doing well on the health indicator with the overall rank declining from 134 to 135 in 2013. On the ranking based on sex ratio at birth, which aims specifically to capture the phenomenon of “missing women” prevalent in many countries with a strong son preference, it can be seen that India’s rank has gone down from 131 to 133 during last year.
On healthy life expectancy, calculated by the World Health Organization, India has slipped from 111 to 112 during the same period. This measure provides an estimate of the number of years women and men can expect to live in good health by taking into account years lost to violence, disease, malnutrition or other relevant factors.
Figure 4
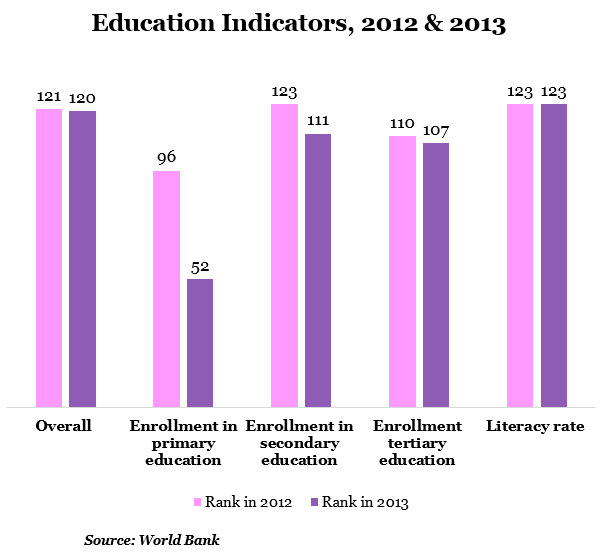
Investment in girls’ education has significant multiplier effects: it reduces high fertility rates, lowers infant and child mortality rates, lowers maternal mortality rates, increases women’s labour force participation rates and earnings and fosters educational investment in children. The gap between women’s and men’s current access to education is captured through ratios of women-to-men in primary-secondary- and tertiary-level education.
Under this category, the rank for primary enrolment has gone up from 96 to 52 during the last year. We have written on the impact of increasing female literacy in India. The rank for enrolment in secondary education has also jumped from 123 to 111 and so has enrolment in tertiary education. This shows that more women are enrolling in education at all levels compared to men. A longer-term view of the country’s ability to educate women and men in equal numbers is captured through the ratio of the female literacy rate to the male literacy rate.
Figure 5
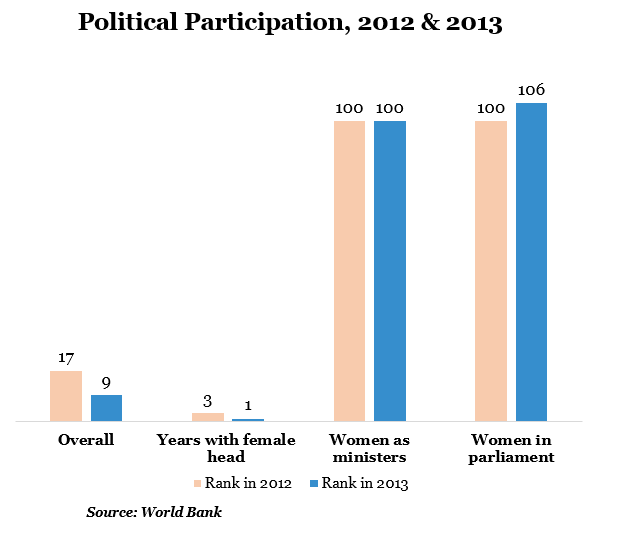
This is the sector where India does the best: this sub-index measures the gap between men and women at the highest level of political decision-making. In addition, we include the ratio of women-to-men in terms of years in executive office (Prime Minister or President) for the last 50 years. Under these categories, the rank for women in Parliament has fallen from 100 to 106 during 2012 to 2013. This indicates that there are fewer women in our Parliament today.
India has scored the number 1 spot under the years with a female head category. There is also some evidence from India to suggest that women in local Governments take decisions with better outcomes for communities than men when charged with budget decisions. They also appear to be more competent representatives than men, obtaining more resources for their constituencies despite having significantly lower education and relevant labour market experience.
Conclusion
The Global Gender Gap report shows that even though India has outperformed when it comes to women in politics, it has not led to transformation in other areas like health and labour force participation. There can be two conclusions from this: firstly, disconnect between the policies we frame for women empowerment and what is actually happening on the ground. Secondly, this raises another question: even though more women are in position of power, are they using it effectively to reduce the gender gap that exists in our country?
