GDP Grew 6.8% Annually In 5 Years To 2015, Jobs 0.6%: New Report Contradicts PM’s Advisers

New Delhi: India lost 7 million jobs over three years to 2015 and “absolute decline” has continued past 2015, according to a report published on September 25, 2018.
The young and those with higher education report a 16% unemployment rate, showing that they have been the worst hit, the report prepared by the Centre for Sustainable Employment (CSE), an arm of Azim Premji University, says.
In the absence of recent government data on jobs, the report is based on data from the National Sample Survey Office and the Employment-Unemployment Survey (EUS) of the Labour Bureau for 2015-16, after which the labour ministry discontinued the survey. It has also examined surveys by the Bombay Stock Exchange-Centre for Monitoring the Indian Economy (CMIE) for the past two years.
A 2018 study prepared for the Prime Minister’s Economic Advisory Council has claimed that the Indian economy generated 12.8 million jobs in 2017. However, the CSE report contradicts this claim. “Unfortunately, this optimistic conclusion depends on selective use of data and unjustified assumptions,” the report says.
Below are some of its most important findings.
India is experiencing jobless growth
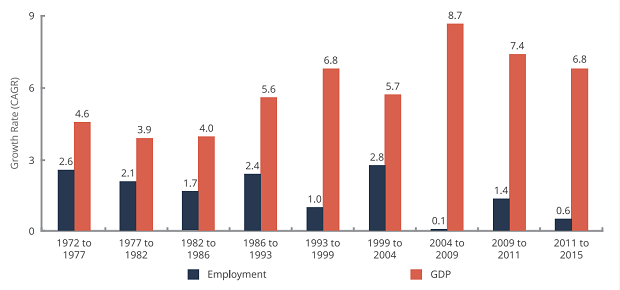
The report has lent credence to the argument that India’s fast economic growth has not generated jobs. “Even as GDP (gross domestic product) growth rates have risen, the relationship between growth and employment generation has become weaker over time,” it says, adding that a 10% increase in GDP now results in less than 1% increase in employment. With a 6.8% annual growth rate of GDP over five years to 2015, India experienced a 0.6% increase in jobs, it has found.
The situation was better in earlier decades. In the 1970s and 1980s, when GDP growth was around 3-4%, employment growth was around 2% per annum, about three times the current growth rate. Since the 1990s, and particularly in the 2000s, GDP growth has accelerated to 7% but employment growth has slowed to 1% or even less, the report says.
Source: Centre for Sustainable Employment
Worst hit are the young, and those with higher education
It used to be said that India’s problem is not unemployment but underemployment and low wages. A new feature of the economy is a high rate of open unemployment--where people do not have job opportunities in tune with their education or skills--the report shows. It puts the figure for open unemployment at over 5% currently. It is highest--about 16%--among the youth and those with higher education, it says.
Almost all the states of the country have been experiencing unemployment, but the northern states including Rajasthan, Uttar Pradesh, Uttarakhand, Bihar, Chhattisgarh, Punjab and Jammu and Kashmir are the worst performers, with rates ranging from 6% to 30% (for 2015).
Wages rising but remain way below minimum recommended salary
Wages grew in most sectors at a 3-4% annual rate over 15 years to 2015. Yet, 67% of households reported monthly earnings of up to Rs 10,000 in 2015, 44% less than the minimum salary of Rs 18,000 recommended by the Seventh Central Pay Commission (CPC) for employees on the lowest pay-scale such as sweepers and peons, as per the report. People earning Rs 50,000 or more per month constitute 1.6% of the Indian workforce.
“This suggests that a large majority of Indians are not being paid what may be termed a living wage, and it explains the intense hunger for government jobs,” the report says.
Over five years to 2015, agriculture recorded the highest annual growth in wages, at 7%, followed by the unorganised services sector with a 4% growth.
During the same period, unorganised manufacturing recorded better annual growth in wages of 4% than organised manufacturing of 2%, the report shows.
The growth of jobs in agriculture comes with a caveat, however: It is based on an assumption that employment is available for 25 days a month and 12 months a year. “However, this is mostly not the case in practice. Hence, these numbers should be treated as an upper bound,” the report says.
Regular jobs pay poorly, contract jobs increasing
Regular jobs, valued for financial security, are not fetching good remuneration, with 57% of regular employees earning Rs 10,000 or less a month, well under the CPC recommendation, according to the report.
While the average monthly salary of regular workers was Rs 13,562, non-regular workers earned Rs 5,853 per month in 2015, the report said.
At the same time, jobs in the sectors known for stable employment are becoming precarious.
An increase in employment in organised manufacturing was an opportunity to provide remunerative and stable employment. Instead, the share of contract work and other precarious forms of labour has grown since the early 2000s, the study has found.
Field studies by the authors of the report found that two of the most common categories of contracts were: Trainee, and apprentice workers who perform the work of permanent workers at a fraction of their wages. “This is one way in which labour laws are being circumvented by manufacturing firms,” it says.
Women earn 65% of men’s earnings, gap narrows with education
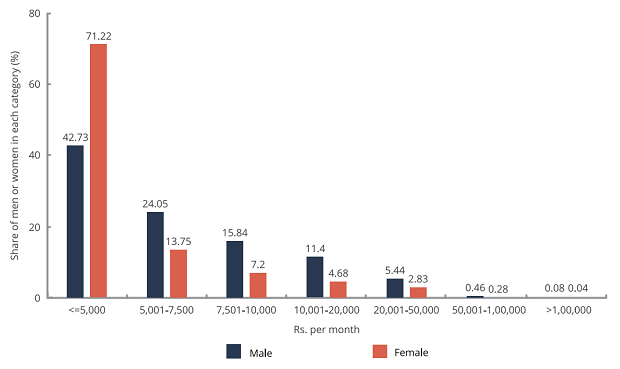
At an all-India level in 2015, women workers earned Rs 5,200 a month on average, about 65% of the average male earnings of Rs 8,000, as per the report.
In 2015, the percentage of men reporting earnings of up to Rs 5,000 was 43%, compared with 71% of women. About 82% of male and 92% of female workers earned less than Rs 10,000 a month, the report has found.
Source: Centre for Sustainable Employment
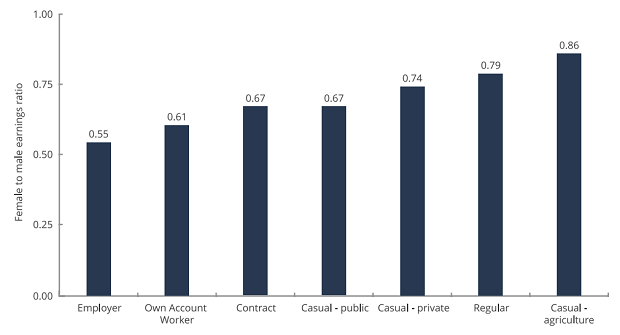
The gender wage gap varies widely. Women earn between 35% and 85% of men’s earnings, depending on the type of work and the level of education.
The disparity is the largest among own-account women workers, who are self-employed and also provide employment to others--say, small shop-owners or a home-based poppadom (‘papad’) manufacturers. The wage gap is the least in casual agriculture work, where women earn about 86% of men’s earnings, the report says.
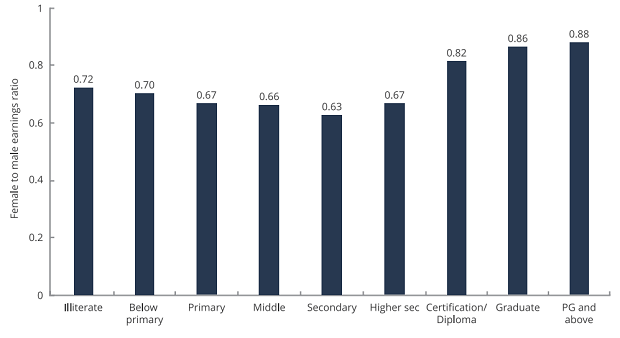
The gap narrows significantly with a rise in women’s education beyond the higher secondary level. Women with education of post graduation and above earn 88% of men’s earnings, as per the report.
Source: Centre for Sustainable Employment
Source: Centre for Sustainable Employment
The share of women in the paid workforce has been declining across major sectors over the 11 years to 2015. In agriculture, the share of women dropped by six percentage points from about 35% in 2004 to 29% in 2015. It dropped by four percentage points in manufacturing, from 26% in 2004 to 22% in 2015.
The northern and western states of India perform the worst in terms of women’s participation in the paid workforce. While only 20 women are in paid employment for every 100 men in Uttar Pradesh and Punjab, this number is 50 in Tamil Nadu and Andhra Pradesh, and 70 in the north-eastern states of Mizoram and Nagaland, the report adds.
Social restrictions and housework, often blamed for women’s shrinking participation in the labour force, are not the primary factor, this report finds. “Field studies suggest that lack of available work, rather than social restrictions, may be preventing women from entering the labour force,” it says.
Caste earnings gap more than gender earnings gap
Workers from the Scheduled Castes (SC) and Scheduled Tribes (ST) are over-represented in low paying occupations (such as agriculture and fisheries, as well as crafts and trade) fetching Rs 4,000 to 8,200 monthly. They are severely under-represented in the high paying occupations (managerial, technical, clerical and professional) fetching Rs 13,000 to 20,000 monthly, according to the report. The trend is opposite for workers hailing from the “upper” castes.
“On the other hand, both SC and ST groups are much better represented in public administration indicating the success of reservation policies over the years,” the report says.
The caste earnings gap is more than the gender earnings gaps, it finds: SC workers earn only 56% of upper-caste earnings, while workers from STs and other backward castes earn 55% and 72% of upper-caste earnings, respectively.
(Tripathi is a principal correspondent with IndiaSpend.)
We welcome feedback. Please write to respond@indiaspend.org. We reserve the right to edit responses for language and grammar.
