Design A New #Breathe Human Interface For Real-time Air Quality Monitoring Data
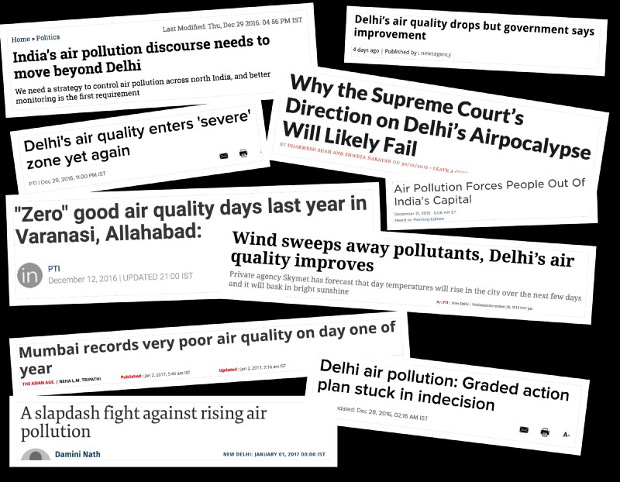
The air we breathe is making us very sick. The mainstream media have managed to bring unprecedented awareness to the issue of the deteriorating air quality condition in all our major cities, especially in North India. We at IndiaSpend have played our part in raising that awareness.
IndiaSpend #breathe is a real-time air-quality monitoring initiative that was launched on December 1, 2015. We currently have sensors active in 15 Indian cities.
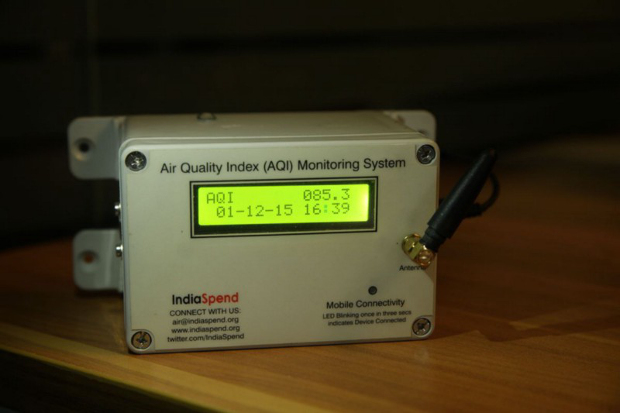
We have built low-cost PM 2.5 & PM 10 (particulate matter smaller than 2.5 and 10 micrometres, or 2.5 µm and 10 µm, respectively) monitoring devices that transmit data in real-time (every 5 mins) to our #breathe servers. You can see our indigenously built device here.
The PM 2.5 & PM 10 data from these sensors are transmitted using a Global System for Mobile communication (GSM) module, the data visualised on this real-time dashboard.
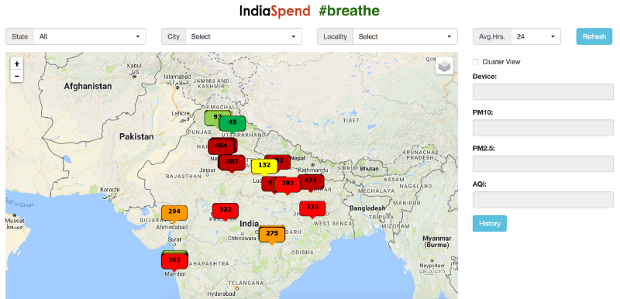
The dashboard has two interfaces. There is a map-based interface on which you can see air quality index (AQI) values for each location:
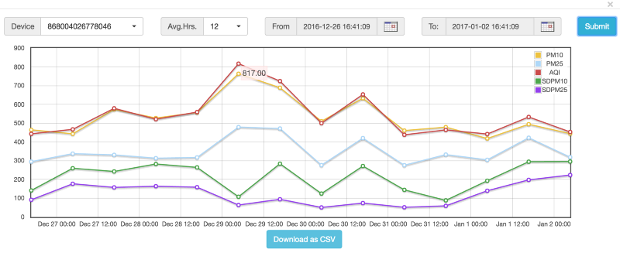
A second “history” interface allows you to look at the historical data between any two dates (provided the device has been active in that duration). The data can be analysed by computing averages over different time-periods, such as 1hr, 2hr, 4hr, 8hr, 12hr, 16hr, 20hr & 24hr. The data can also be downloaded as a comma separated values (CSV) file.
Now, we want to re-design this real-time air-quality monitoring dashboard, so that the data visualised are made relevant to all kinds of users?—?data journalists, citizen scientists, air-quality enthusiasts, open-data developers, computer-science researchers; essentially, just about anyone who is interested in understanding the air quality in their neighbourhood and their country better.
A few global initiatives, such as the OpenAQ and AQICN, have built portals & interfaces providing a global view of current air-quality conditions.
We believe Indian users are interested in a local context to air-quality conditions. This would include real-time and historical data related to air quality, but also include stories of people and their lives in the context of deteriorating air-quality conditions.
We would like to invite designers and human-interface researchers to provide inputs for the next version of the #breathe dashboard. If you have ideas or suggestions on how to communicate air-quality data to users better, we would like to hear from you.
Please send your suggestions for the new interface dashboard to air@indiaspend.org. All inputs will be duly acknowledged and credited. If you would like a monetary compensation, let us know, and we will confirm if we can manage this.
