Delhi Had Clean Spring Air – But It Won't Last
As winter soon descends on Delhi, the city can expect air that is more than twice as polluted than during the spring and summer.
Every Delhiite knows that air pollution varies by season. But not every Delhiite knows that it varies in type, by time of day and day of the week. This variation might make a difference to the way the city’s residents plan their activities, and it certainly should influence how policymakers design an approach to the problem.
The Central Pollution Control Board and Air Quality Index websites are both useful for finding real-time air pollution readings around the city, but they don’t track or analyse broad patterns. We examined ambient air pollution data going back to 2012 from the CPCB website and found some interesting results.
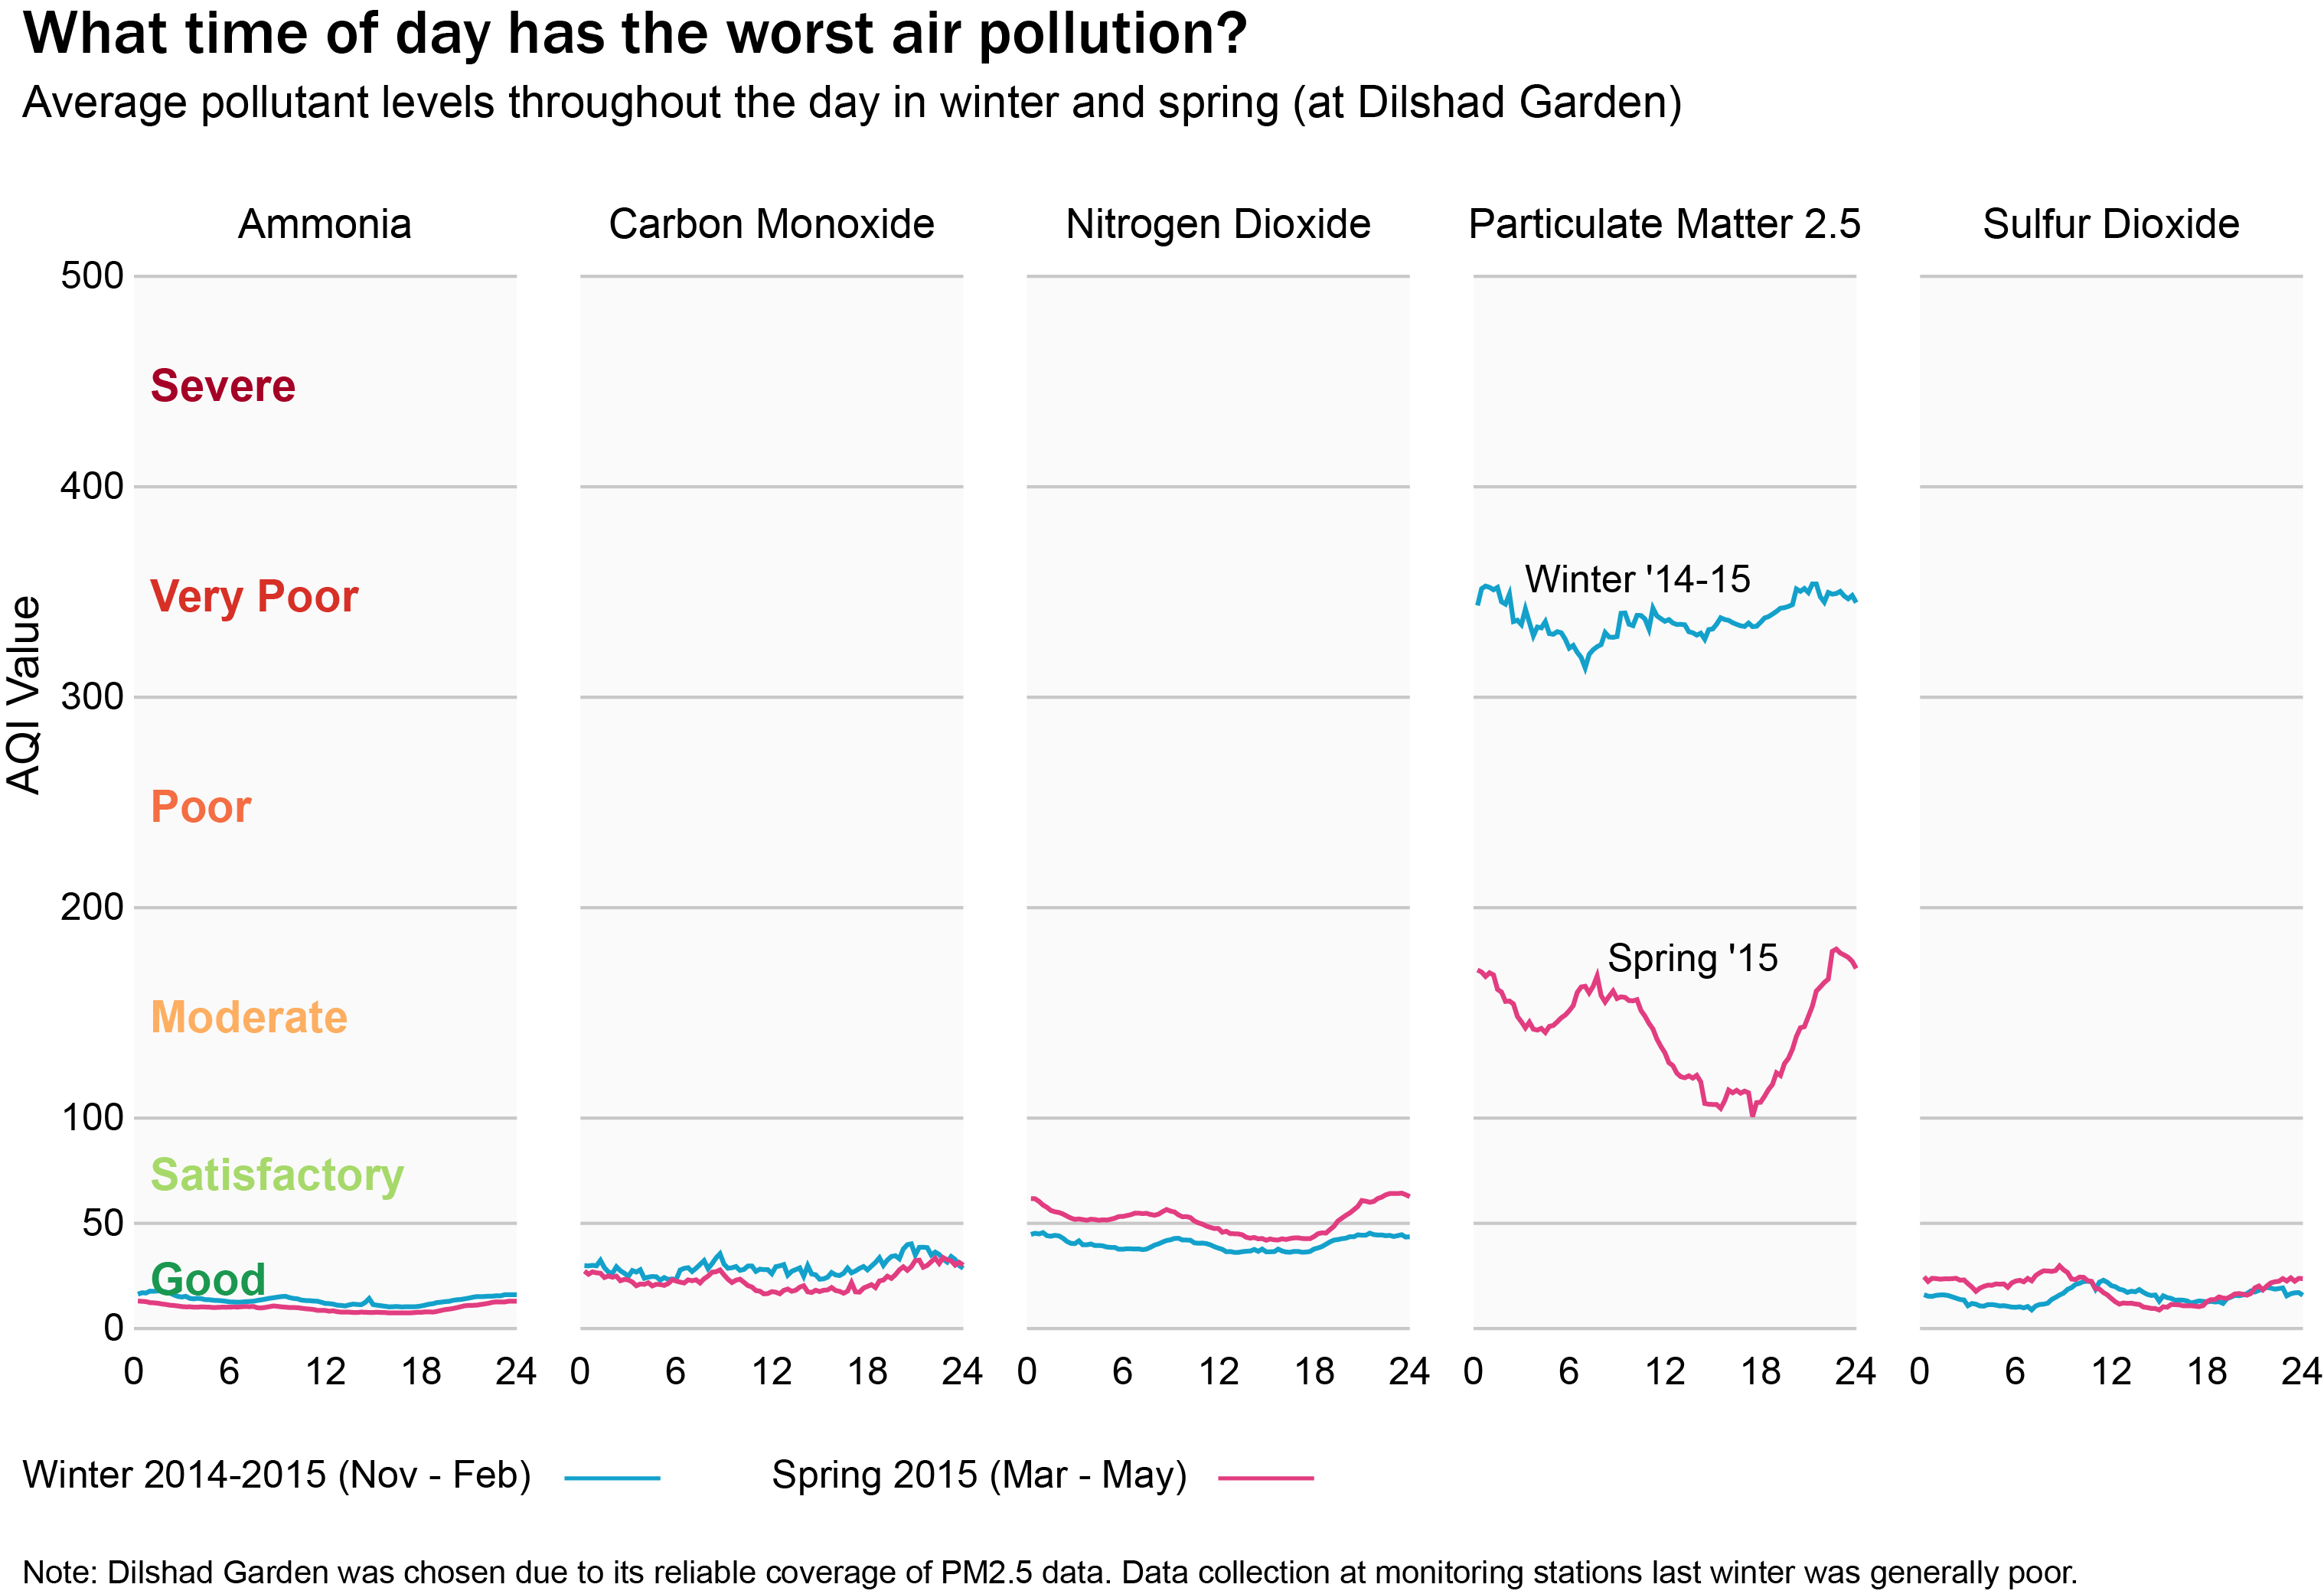
As you can see in the chart below, one of Delhi’s biggest problems is with PM (Particulate Matter) 2.5, particles of soot and other contaminants suspended in the air, 2.5 micrometers in diameter and smaller, about 30 times finer than a human hair, a size that allows them to be trapped in the lungs. PM 2.5 is the pollutant of greatest concern to public health, as it has been shown to cause lung cancer, cardiovascular and respiratory diseases, asthma, and a host of other health problems.
On an average day last winter, concentrations of PM 2.5 exceeded 200 micrograms per cubic meter (ug/m3), earning a Very Poor rating on the new Air Quality Index (AQI). An average day this spring was about half as polluted, 104 ug/m3, earning a ‘Moderate’ rating. Among other pollutants being measured by the AQI, only Nitrogen Dioxide ever crossed below the Good range, and our analysis shows that it was actually higher in spring than in winter.
Source: Central Pollution Control Board; View raw data here.
So, why is PM2.5 so high in winter?
One reason is that several major polluting activities increase as winter approaches. People burn more biomass to heat their homes within the city, and the end of the harvest season means that farmers burn the stubble off their fields. NASA has released satellite images of the great plumes of smoke from burning rice paddies in Punjab in October and November.
Also, while the Supreme Court banned brick manufacturing in Delhi in 1996, industry responded by shifting production to just outside the city’s borders. Today, more than 1000 brick kilns operate inside the National Capital Region and their main production period coincides with Delhi’s winter season. One study estimates that 15% of the PM 2.5 affecting Delhi can be attributed to brick kilns, putting kilns on par with truck traffic and power generation as sources of PM 2.5.
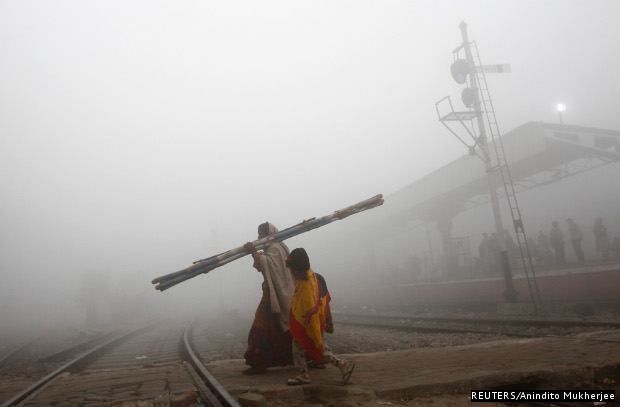
These seasonal increases collude with meteorological forces. During the winter months, cool air stagnates over the city, keeping pollution close to the ground where people breathe. Delhi’s persistent winter fog only worsens the problem.
Stagnant air explains why pollution levels vary less widely over the day in winter than in spring, as is evident in the chart above. In spring, warm, rising air moves pollution out, so the average pollution at ground level follows more closely the profile of polluting activities throughout the day. During the afternoon when people are at work, it drops, only to rise again with the evening rush hour. It stays relatively high overnight, likely due to the practice of trucking goods, not only in and out but through Delhi. The Supreme Court has just approved an “environmental compensation charge” that will take effect 1 November and make the short cut more costly.
In spring, the safest time to go for a run is six in the evening. In winter, sluggish air means that the safest time is seven in the morning – and by a much smaller margin.
Stagnant air also explains why, as evident in the chart below, pollutants accumulate throughout over the workweek in winter, and why spring sees more variation within days.
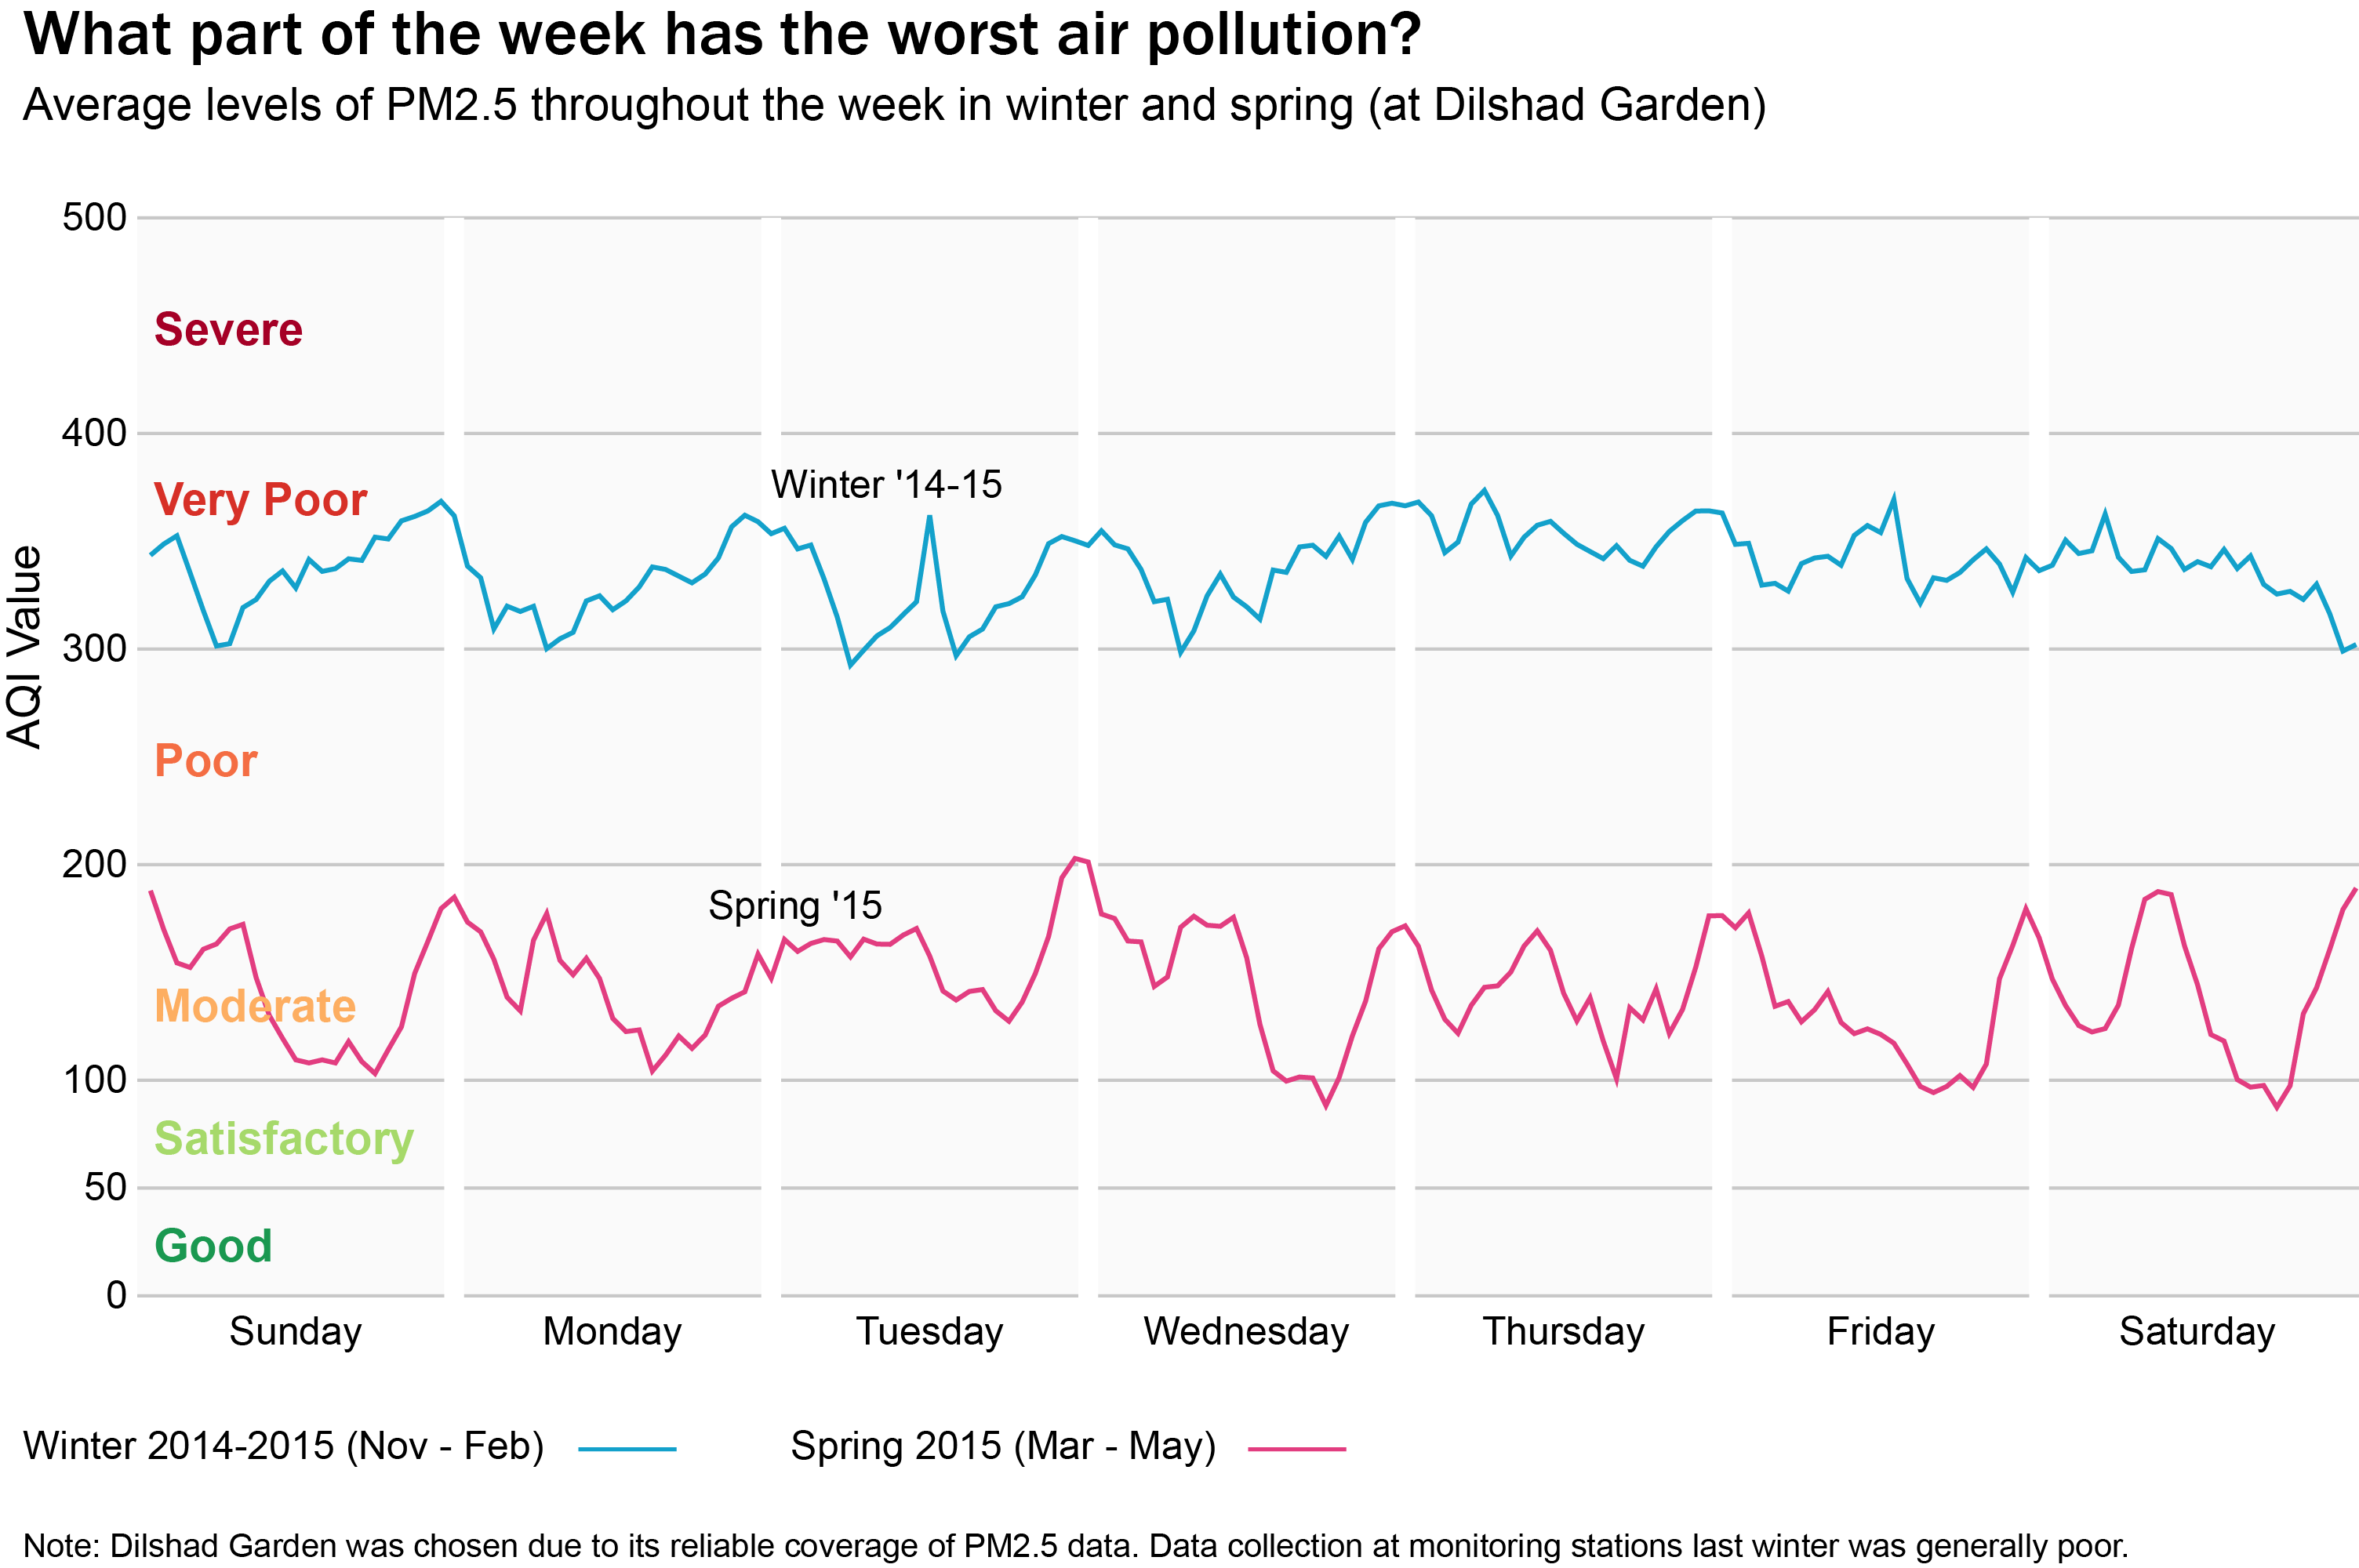
Source: Central Pollution Control Board; View raw data here.
The AQI in its current form describes the type of health risks of each pollution level but doesn't provide recommended actions. Also, there is no widespread information dissemination system in place. Many other countries have health alert networks that disseminate information through text messages and TV news tickers when pollution is high. These would make good valuable add-ons to the Index, allowing residents to protect themselves and plan their activities around the worst of Delhi’s bad air.
(Eric Dodge is Data Analytics Lead with Harvard University's Evidence for Policy Design. Kevin Rowe is a PhD. Student at Harvard University.)
“Liked this story? IndiaSpend.org is a non-profit, and we depend on readers like you to drive our public-interest journalism efforts. Donate Rs 500; Rs 1,000, Rs 2,000.”
