Delhi Air Quality Plunges, IndiaSpend Rejigs Sensor Readings
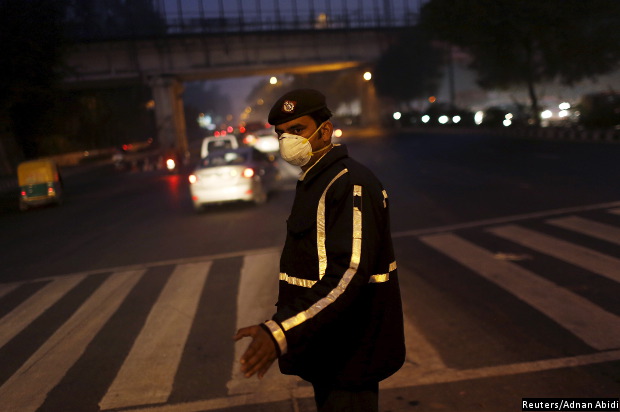
A traffic policeman wears a mask to protect himself from dust and air pollution as he signals to drivers in New Delhi, India, December 23 was officially the capital city's 'most polluted day of the year'.
December 23 was officially New Delhi's 'most polluted day of the year'. The Central Pollution Control Board (CPCB) stated that the Air Quality Index (AQI) was 430-435 in Delhi on Wednesday, which it considers 'severe'.
What is not commonly known is that the AQI regularly exceeds 500 in many parts of the city, but CPCB only displays a maximum AQI value of 500 on its website. For instance, the government AQI monitors at Anand Vihar have shown the minimum, maximum and average AQI levels as 500 for December 23.
Among the pollutants monitored to arrive at an AQI value, PM2.5, which are fine particulate matter found in the air with a diameter of 2.5 micrometres or less, and are known to pose the greatest risk to human beings. Their measurement is considered to be the best indicator of the level of health risks from air pollution, according to the World Health Organization (WHO).
While PM2.5 remain the deadliest of all pollutants, PM10 seems to be a cause of the current deterioration of air quality in Delhi. PM10, or coarse particulate matter with diameter between 2.5 and 10 micrometers, are primarily made up of dirt and dust from farming, factories and roads, and caused due to the crushing of rocks and soil.
| AQI Category, By PM10 Levels | |
|---|---|
| PM10 Level | AQI Category |
| 0-50 | Good (0-50) |
| 51-100 | Satisfactory (51-100) |
| 101-250 | Moderate (101-200) |
| 251-350 | Poor (201-300) |
| 351-430 | Very Poor (301-400) |
| 430+ | Severe (401-500) |
Source: Central Pollution Control Board; PM10 levels in micrograms per cubic metre (µg/m³)
An analysis of five locations of the #Breathe monitoring stations in New Delhi has found that the AQI levels on December 23 at all five locations were well above the severe levels, with Gurgaon reporting PM10 levels which were 45% higher than CPCB's 'severe' rating of AQI 500, and 11 to 14 times the World Health Organization's safe air guideline of 50 micrograms per cubic metre (µg/m³).
So far, the IndiaSpend #Breathe monitoring stations have been showing AQI values up to a maximum of 500, based on the AQI breakpoints provided in the CPCB guidelines (pg 18/Table 3.2 of National Air Quality Index by CPCB).
| AQI | Associated Health Impacts |
|---|---|
| Good (0-50) | Minimal impact |
| Satisfactory (51-100) | Minor breathing discomfort to sensitive people |
| Moderately polluted (101–200) | Breathing discomfort to people with sensitive lungs, asthma and/or heart diseases |
| Poor (201-300) | Breathing discomfort to most people on prolonged exposure |
| Very poor (301-400) | Respiratory illness on prolonged exposure |
| Severe (401-500) | Affects healthy people and seriously impacts those with existing diseases |
Source: Central Pollution Control Board
The AQI description categories adopted for India, as seen above, have a maximum AQI range of 401-500. So, what CPCB makes of AQI levels of 600 or 700, for instance, remains unclear.
The frequent 'Severe' conditions being experienced in New Delhi, which are going way past the AQI breakpoint of 500, have now warranted us to not limit the displaying of AQI values at 500 but to display the actual AQI Sub-index values of a given place.
This is also in line with the approach taken by other global AQI initiatives such as aqicn.org which show the AQI Sub-Index and mark the primary pollutant on their map displays.
Delhi would benefit if the government introduces dust control for construction sites, landfills and roads. The California EPA has also used landscaping, barrier, and fencing to reduce windblown dust to control the sources of PM10 emissions.
We welcome feedback. Please write to respond@indiaspend.org. We reserve the right to edit responses for language and grammar.
__________________________________________________________________
Liked this story? Indiaspend.org is a non-profit, and we depend on readers like you to drive our public-interest journalism efforts. Donate Rs 500; Rs 1,000, Rs 2,000.
