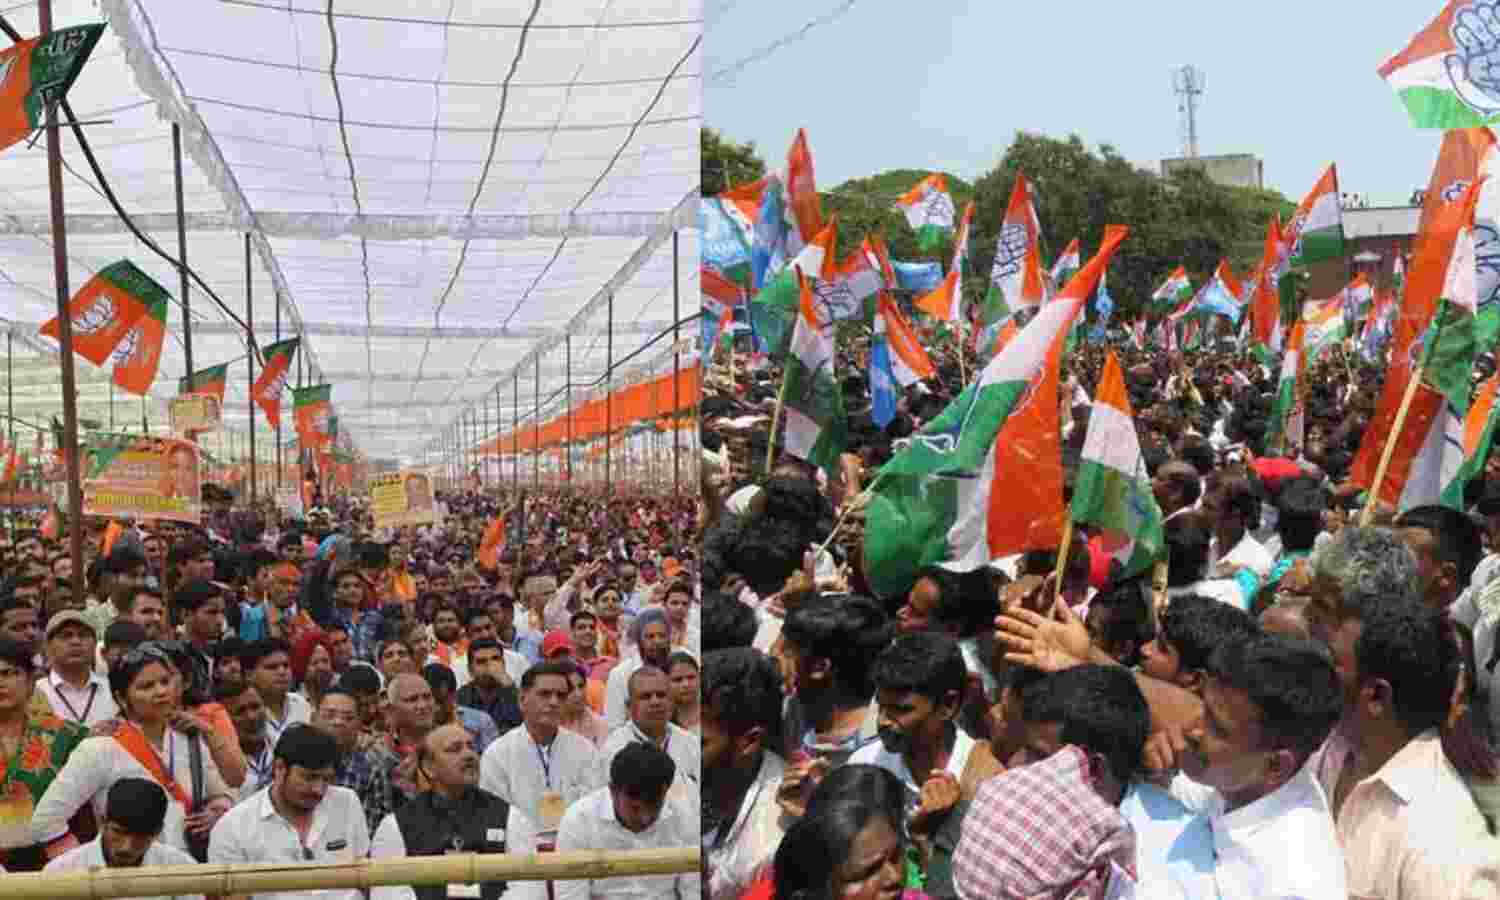
BJP’s Income Rose 81% in 2017, Congress’ Declined 14%

Mumbai: With its income rising 81.2% over a year to 2016-17, the income of the ruling Bharatiya Janata Party (BJP) accounts for two-thirds (66.3%) of the total income of India’s political parties, according to a report by Association for Democratic Reforms (ADR), an advocacy.
The BJP’s current income is Rs 1,034.28 crore, nearly equal to the total income of all national parties in the previous year. The party’s income in 2015-16 was Rs 570.86 crore.
This is also the highest income the party, which has 273 seats in the Lok Sabha (Parliament’s lower house)--its highest ever--has generated in the last four years since 2014, according to an IndiaSpend analysis of yearly reports by the ADR.
Meanwhile, the Congress, which has 48 seats--its lowest ever--received its lowest income in four years.
The Congress earned Rs 225.36 crore in 2016-17, a drop of 13.8% from Rs 261.26 crore the previous fiscal year. Its share of total political party income dropped 10.8 percentage points, from 25.3% in 2015-16 to 14.5% in the current year.
The income of the seven national parties increased 50.9%, from Rs 1,033.18 crore in 2015-16 to Rs 1,559.17 crore in 2016-17.
While the BJP and Congress have the highest share of the total income earned by all political parties, both the Bahujan Samaj Party (BSP) and the National Communist Party (NCP) reported the highest percentage increase in income over the financial year to 2016-17.
The BSP’s income increased from Rs 47.38 crore to Rs 126.19 crore, while the NCP witnessed a rise in income from Rs 9.14 crore to Rs 173.58 crore between the financial years 2015-16 and 2016-17, increases of 266.3% and 88.6% respectively.
Along with the Congress, the income of the All India Trinamool Congress (AITC) and Communist Party of India - Marxist (CPM) declined 81.5% and 6.7%, respectively.
Major sources of income: Donations, contributions and coupons
Both the BJP and the Congress declared donations and contributions as their main source of income. While grants/donations/contributions made up 96.4% (Rs 997.12 crore) of the BJP’s income in 2016-17, they made up 22.5% (Rs. 50.6 crore) of the Congress’ income.
The largest share of income for the Congress came from issuing coupons of various denominations (worth Rs 100-500 and more) to party members and identified donors, for fundraising.
The coupons--which accounted for 51.3% (Rs 115.6 crore) of the party’s income in the year 2017--were introduced by a committee under former Prime Minister Manmohan Singh in 2001 to bring more transparency to the party’s fundraising process, the Hindu reported on December 22, 2001.
“However, these coupons are neither numbered nor can they be tracked, which makes it impossible to audit the contributions or where the income is coming from,” ADR’s founder-trustee Jagdeep Chhokar, a former professor and director of the Indian Institute of Management, Ahmedabad, told IndiaSpend. “All recommendations for issuing numbered coupons were rejected by the party, which eliminates transparency from the equation.”
Details of the donors and contributors were marked as “unavailable” or left blank on most disclosures filed by parties.
| Income Of BJP And Congress, Top 3 Sources | ||
|---|---|---|
| Party | Source | Income % |
| BJP | Voluntary Contributions | 96.40% |
| BJP | Interests from Banks | 3% |
| BJP | Fee and Subscription | 0.40% |
| Congress | Income from Issuance of Coupons | 51.30% |
| Congress | Donations and Contributions | 22.50% |
| Congress | Interests on Fixed Deposits | 19.50% |
Source: Association for Democratic Reforms
The deadline for submitting the annual audited accounts for the parties was October 30, 2017. Four of seven national parties (BJP, Congress, NCP and CPI) have a record of consistently delaying audit reports over the past five years.
While the BJP and Congress delayed audit reports by an average of six months over the last five years year, for the current year, their submissions were delayed by almost three and five months, respectively.
BJP outspent Congress by 120.7% in 2016-17
While the BJP’s earnings have risen significantly, its expenditure has not kept pace over the four years to 2017.
While the BJP’s income over the 2016-17 increased 81.2%, as we said, its expenditure rose 61.8%. The highest year-on-year increase in the BJP’s expenditure was in 2014-15: up 177.9%, from Rs. 328.51 crore in 2013-14 to Rs 913 crore in 2014-15.
However, in 2016-17, the Congress spent more than it earned.
Even with a nearly 14% drop in income in the year 2017, Congress expenditure rose 66.4% over the previous year. In contrast, during 2015-16, Congress expenditure fell 74.7%, from Rs 765.02 crore in 2014-15 to Rs 193.26 crore in 2015-16.
Election spending is main political expenditure
Elections and general propaganda accounted for the largest share (85.4% or Rs 606.64 crore) of the ruling party's expenditure.
The Congress spent 46.5% (Rs 149.65 crore) of its expenditure on elections and 35.9% (Rs 116.7 crore) on administrative and general expenditure.
| Election Expenditure, By Share Of Expenses | ||
|---|---|---|
| Party | Top 3 Items of Expenditure | % of Expenditure |
| BJP | Election/General Propaganda | 85.40% |
| BJP | Administrative Costs | 9.80% |
| BJP | Employee Costs | 2.90% |
| BJP | Others | 1.90% |
| INC | Election Expenditure | 46.50% |
| INC | Administrative and General Expenditure | 35.90% |
| INC | Financial Costs | 9.70% |
| INC | Other Expenditure | 7.90% |
Source: Association for Democratic Reforms
(Prabhu is a data analyst with IndiaSpend.)
We welcome feedback. Please write to respond@indiaspend.org. We reserve the right to edit responses for language and grammar.


