5 Days To Polls, More Support For BJP, But 40% Of Uttar Pradesh Voters Undecided
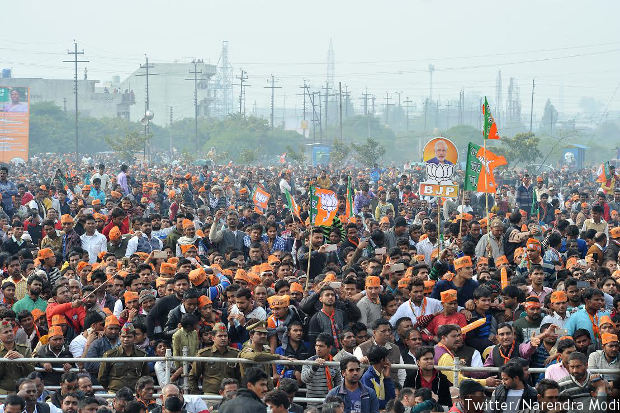
Supporters of the Bharatiya Janata Party (BJP) cheer ahead of a speech by Prime Minister Narendra Modi at an election rally in Meerut. With Uttar Pradesh going to elections in five days, 28% voters support the BJP, while 40% of voters remain undecided, according to a survey.
Elections for the Uttar Pradesh state assembly, India’s largest state with more voters--138 million--than the population of the north American country of Mexico, start on February 11, 2017, but 40% of its voters said they still don’t know which political party they will vote for, according to a new survey conducted by by FourthLion Technologies, a data analytics and public opinion polling firm, for IndiaSpend.
The firm conducted 2,513 telephone interviews in Hindi of registered voters in Uttar Pradesh, and said their sample is representative of UP’s urban and rural voters as well as socioeconomic, age, gender and caste make-up. The survey was conducted between January 24 and January 31, 2017.
The first article on the survey analysed issues that voters said were important to them.
Overall, 28% of those surveyed said they would vote for the Bharatiya Janata Party (BJP), the party that heads the central government, if the polls were held immediately, while 18% of those surveyed would vote for the Samajwadi Party (SP) that currently leads the state, 4% would vote for the Bahujan Samaj Party (BSP) led by Mayawati, the chief minister of Uttar Pradesh between 2007 and 2012, while 1% would vote for the Indian National Congress (INC).
The FourthLion-IndiaSpend survey asked voters about the the four parties that won the most seats in the last state and parliamentary elections. The survey did not measure how many seats a party would win, and only suggests popular support for different political parties. It cannot be interpreted as indicative of election results.
Source: FourthLion-IndiaSpend survey
Key to popular support: Undecided voters
The large percentage of undecided voters (40%) suggests that any party could have more popular support.
The survey found that half of all women are undecided, as are 45% of those between the age of 30 and 44 years, 42% of those living in rural areas, 43% of Dalits, 44% of those from Other Backward Classes, and 43% of the poor. The indicator on income is based on vehicle ownership, with the poorest owning no two-wheeler or car.
Out of all those who said they hadn’t decided whom to vote for, a majority were from Other Backward Classes (38%) and Dalit (21%). As many as 70% also said they owned no vehicle, which could be a sign of the level of income.
“People don’t want to give away which party they support,” and so say that they haven’t decided, said Neelanjan Sircar, senior fellow at the New-Delhi based Centre for Policy Research, a public policy think tank. He explained that many people want to vote for the winning party, as that might be a criteria for getting benefits after the election. Or, voters might talk with family members and friends and take the decision a day or two before election day, said Sircar.
The election in the state is in seven phases, over one month, beginning February 11, 2017, in the west of the state, in the region bordering the capital city of New Delhi, and moving to the east towards the state of Bihar. Voters might decide whom to support based on which party they perceive has greater support in the first few phases.
“Recent electoral trends have shown that the first few phases end up having disproportionate influence over the electoral mood,” wrote Prashant Jha, author and associate editor of Hindustan Times, in January 2017.
“Most voters make-up their mind much before the election,” said Yashwant Deshmukh, founder and editor of C-Voter, a Noida-based election research and polling organisation, and change their mind only if anything very critical happens. Some voters who are particularly sensitive to caste or religion might wait until the candidate is announced to decide whom they will vote for, he added.
Source: FourthLion-IndiaSpend survey
Who are the decided voters?
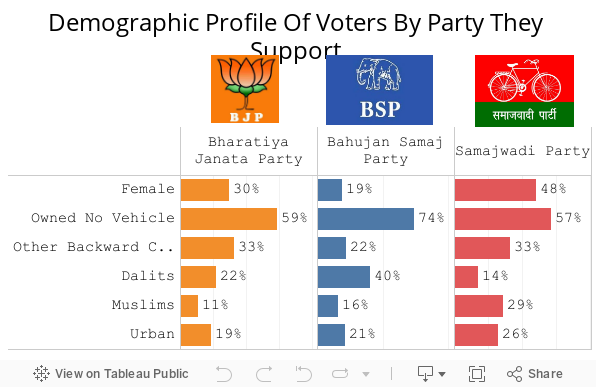
As many as 33% of those supporting the BJP said they were from the Other Backward Classes, 11% said they were Muslims, while 22% said they were Dalits. A higher percentage of the SP’s supporters said they were Muslim (29%), while fewer said they were Dalits (14%). Most of BSP’s supporters identified as Dalits (40%), while 22% said they were from the Other Backward Classes, and 16% said they were Muslim.
Source: FourthLion-IndiaSpend survey
In 2014, the BJP had won 81% of 403 seats in the parliamentary elections, and “it would take a massive shift of loyalties” of BJP voters in 2014 for the party to lose the 2017 state assembly election, according to a January 2017 analysis by Praveen Chakravarty, a senior fellow in political economy at IDFC Institute.
Both parliamentary and state elections in India take place every five years, though they follow different cycles. The last state assembly election in Uttar Pradesh was in 2012, when the SP won 224 seats to form the government. The BJP had won 47 seats, the BSP 80 seats, and the INC 28 seats. Other parties, including the Rashtriya Lok Dal and the Qaumi Ekta Dal, won 24 seats.
(Shah is a writer/editor with IndiaSpend.)
We welcome feedback. Please write to respond@indiaspend.org. We reserve the right to edit responses for language and grammar.
__________________________________________________________________
“Liked this story? Indiaspend.org is a non-profit, and we depend on readers like you to drive our public-interest journalism efforts. Donate Rs 500; Rs 1,000, Rs 2,000.”
