15 Days After Odd-Even, Delhi’s PM 2.5 Levels Rise 15%
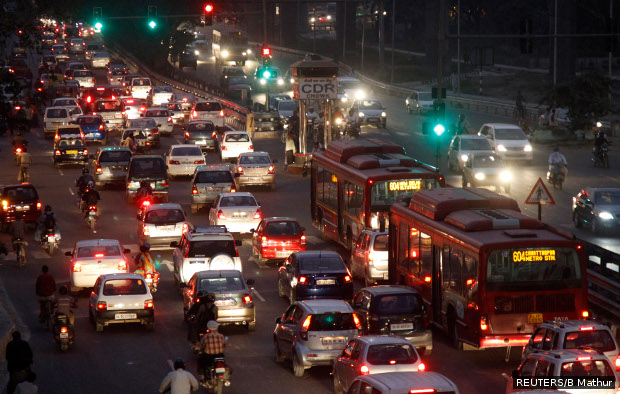
Air-pollution levels in Delhi rose 15% during the 15-day period (January 1 to 15, 2016) of the state government’s odd-even measure over the previous 15 days (December 17 to 31, 2015), according to an analysis of PM (particulate matter) 2.5 data, generated by IndiaSpend’s #Breathe air-quality monitoring devices.
The increase in PM 2.5 level indicates the need to understand deeper the impact of policy changes, such as the odd-even measure, on Delhi’s air, as IndiaSpend reported, and, with four-wheeled vehicles accounting for no more than 10% of the city’s overall vehicular pollution load, according to a new Indian Institute of Technology (IIT) study, the need for other measures is obvious.
Source: #Breathe; Note: Data for Jan 7, 2016 are from 12 AM to 6 PM, data for Jan 8, 2016 are from 12 PM to 11:59 PM, for Dec 31, 2015 and Jan 15, 2016 the data are from 12 AM to 4:30 PM.
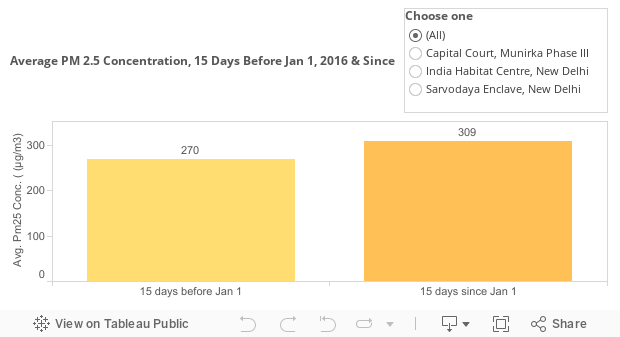
Average PM 2.5 concentration in Delhi’s air was 309 micrograms per cubic metre (µg/m³) during the period when the odd-even experiment was in force (January 1 to 15, 2016), remaining at ‘severe’ levels, according to the guidelines of the Central Pollution Control Bureau (CPCB). This kind of air can affect healthy people and seriously impact those with existing diseases.
Compared to this, average PM 2.5 concentration was 270µg/m³ in the 15 days prior to the odd-even experiment.
Our analysis is based on weekly average data recorded by three #Breathe devices across Delhi at Sarvodaya Enclave, India Habitat Centre and Munirka.
IndiaSpend's breathe air quality network was discussed in this India Today broadcast:
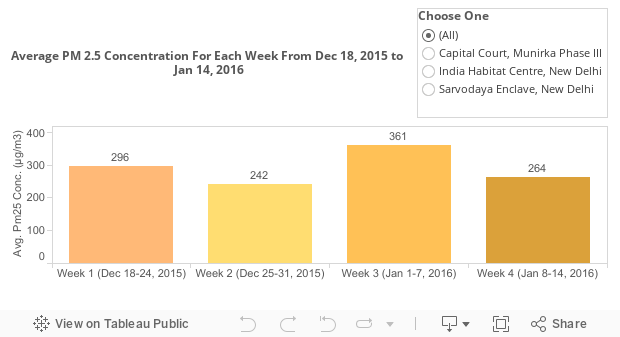
PM 2.5 levels dropped 37% from week 3 (January 1 to 7, 2016) to week 4 (January 8 to 14, 2016), based on a weekly analysis of PM 2.5 concentration data (refer to graph below). The odd-even scheme was active during this period.
Source: #Breathe; Note: Data for Jan 7, 2016 are from 12 AM to 6 PM, data for Jan 8, 2016 are from 12 PM to 11:59 PM, for Dec 31, 2015 and Jan 15, 2016 the data are from 12 AM to 4:30 PM.
This decrease could be attributed by an increase in wind-speed, which dissipated air pollutants, as these tweets on Saturday, January 16, 2016, indicated:
All 16 #breathe devices in Delhi show good to moderate conditions. Screenshot taken at 3:56PM. pic.twitter.com/bt0vVQnF1X
— IndiaSpend (@IndiaSpend) January 9, 2016
High wind speeds helping Delhi #breathe better today. Screenshot taken from DPCC's website. pic.twitter.com/qIpqNLMkeH
— IndiaSpend (@IndiaSpend) January 9, 2016
This comes after a 50% increase in PM 2.5 concentration from week 2 to week 3, as we reported last week.
PM 2.5 are fine particulate matter with a diameter of 2.5 micrometres or less and are known to pose the greatest risk to human beings. Their measurement is considered to be the best indicator of the health risks from air pollution, according to the World Health Organization (WHO).
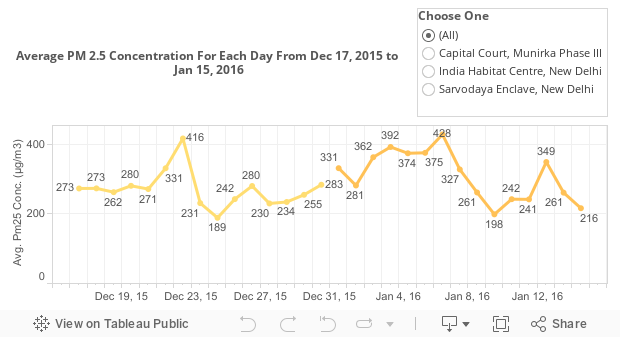
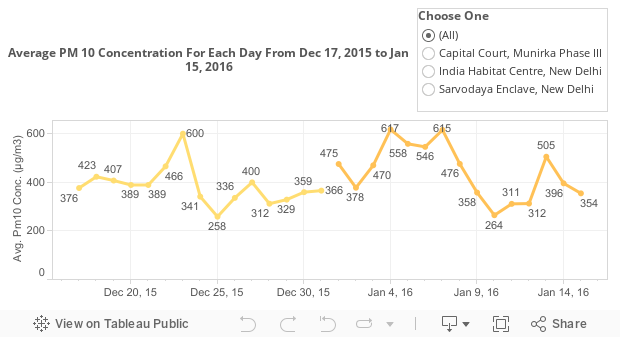
On average, daily PM 2.5 concentration levels have been above 250 µg/m³ on 11 out of 15 days during which the odd-even rule was enforced, attaining a ‘severe’ rating. The remaining four days witnessed ‘very poor’ conditions. This could lead to respiratory illness on prolonged exposure.
Source: #Breathe; Note: Data for Jan 7, 2016 are from 12 AM to 6 PM, data for Jan 8, 2016 are from 12 PM to 11:59 PM, for Dec 31, 2015 and Jan 15, 2016 the data are from 12 AM to 4:30 PM.
Five out of the 15 days prior to the odd-even experiment witnessed ‘very poor’ PM 2.5 concentration, while 10 days saw ‘severe’ conditions.
PM 10 (particles between 2.5 to 10 µm in diameter), during the 15-day odd-even experiment, recorded ‘severe’ ratings for eight days, ‘very poor’ for four days and ‘poor.’
Source: #Breathe; Note: Data for Jan 7, 2016 are from 12 AM to 6 PM, data for Jan 8, 2016 are from 12 PM to 11:59 PM, for Dec 31, 2015 and Jan 15, 2016 the data are from 12 AM to 4:30 PM.
The 15 days prior to the odd-even experiment saw two days of ‘severe’ PM 10 concentration, eight day of ‘very poor’ and two days of ‘severe’ conditions.
The hourly average PM 2.5 levels for the 15 days before Jan 1, 2016 were the highest between 7 am and 8 am (366 µg/m3), and lowest between 3 pm and 4 pm (137 µg/m3). In comparison, since Jan 1, 2016, they have both risen. The hourly average for 7 am to 8 am has risen 2% to 374 µg/m3 and the low at 3 pm to 4 pm has risen 54% to 211 µg/m3.
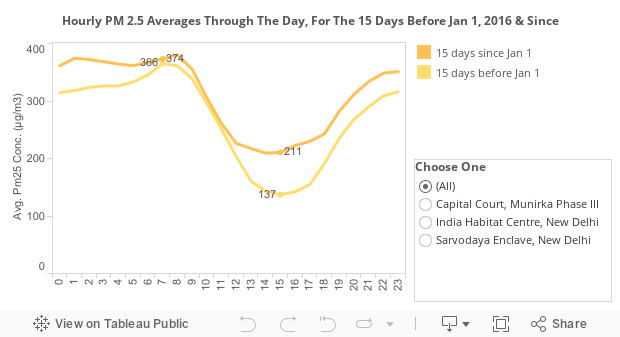
Source: #Breathe; Note: Data for Jan 7, 2016 are from 12 AM to 6 PM, data for Jan 8, 2016 are from 12 PM to 11:59 PM, for Dec 31, 2015 and Jan 15, 2016 the data are from 12 AM to 4:30 PM.
Road dust is leading polluter, trucks second and two-wheelers third. Cars are fourth
Vehicles are number four in the hierarchy of pollution sources, accounting for 20% of PM 2.5 and 9% of PM 10 concentration in Delhi’s air, according to a new study—one of the most comprehensive in recent times—by IIT, Kanpur.
Road dust is the city’s biggest polluter, accounting for 38% of PM 2.5 and 56% of PM 10 concentration. There are many more measures that Delhi needs to adopt to control pollution, as IndiaSpend reported earlier, and as the government says it will, according to this announcement.
Two wheelers, which are exempt from the odd-even rule, account for 33% of all PM10 and PM 2.5 emissions by vehicles, according to the IIT-Kanpur study.
Trucks emit 46% of all PM10 and PM 2.5, among vehicles, and are allowed to ply on roads only after 10:30 pm. Previously, they could travel 9 pm onwards.
Four-wheelers contribute to 10% of all PM 10 and PM 2.5 emissions by vehicles.
We welcome feedback. Please write to respond@indiaspend.org. We reserve the right to edit responses for language and grammar.
__________________________________________________________________
Liked this story? Indiaspend.org is a non-profit, and we depend on readers like you to drive our public-interest journalism efforts. Donate Rs 500; Rs 1,000, Rs 2,000.
