Gujarat’s Social Progress Yet To Match Economic Success
| Highlights * Literacy rate went up from 69.1% in 2001 to 79.3% in 2011 but Gujarat still 18th in all-India ranking. * Gujarat at 24th spot in sex ratio; state way behind the national average of 940 females per 1,000 males. * Poverty reduction of 8.6% in 5 years (2005-10); behind states like Orissa (19.2%), Maharashtra (13.7%) and Tamil Nadu (13.1%). |
Gujarat state elections are near and IndiaSpend has analysed the performance of the Narendra Modi government in two articles that looked at the general economy and finances. Now, we look at the state’s achievements in the social sector.
To get a general idea of where Gujarat stands, let us look at the broad indicators like the total population, literacy rates and the sex ratio of the state.
Table 1: General Social Indicators
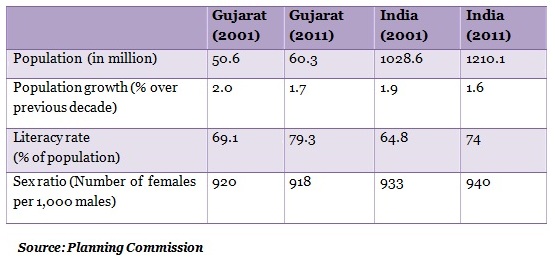
The population of Gujarat (Table 1) stood at 60.3 million in 2011, which is 4.9% of the total Indian population. The increase over the last decade was 9.7 million people. Over 1991-01, the population grew at 2% rate, which then slowed down to 1.7% over 2001-11.
Literacy rate went up from 69.1% in 2001 to 79.3% in 2011. Despite the good increase in the literacy rate of more than 10% over the decade, Gujarat still has a lot to achieve, given that it stood 18th when figures for all the 35 states and union territories are taken into account. The literacy rate at the national level was 74% in 2011.
In 2011, 87.2% of Gujarati males were literate as against 70.7% of females; a gap of 17.2%. The corresponding all-India figures are 82.1% and 65.4%; a gap of 16.7%.
The sex ratio showed a decline from 920 females per 1,000 males in 2001 to 918 females per 1,000 males in 2011. This is worrying not only because of the decline but also because in 2011, Gujarat stood at the 24th spot out of the 35 states and union territories. The state was way behind the national average of 940 females per 1,000 males.
Poverty Reduced But Lot Still To Be Done
The total number of poor people in Gujarat in 2004-05 was 17.1 million or 31.6% of the population. In 2009-10, there were only 13.6 million poor people or 23% of the population. So, there has been a reduction of poverty by 3.5 million or 8.6% over the 5-year period.
The performance of Gujarat in poverty reduction can be considered average. Among the states where the number of poor people declined, an 8.6% reduction of Gujarat was behind states like Orissa (19.2%), Maharashtra (13.7%), Tamil Nadu (13.1%), Madhya Pradesh (11.9%), Karnataka (9.7%) and Rajasthan (9.6%). However, it must be noted that with the exception of Tamil Nadu, all the other states had a higher baseline (in terms of percentages) of poverty compared to Gujarat in 2004-05.
Let us now look at education and health:
Table 2: Educational Indicators
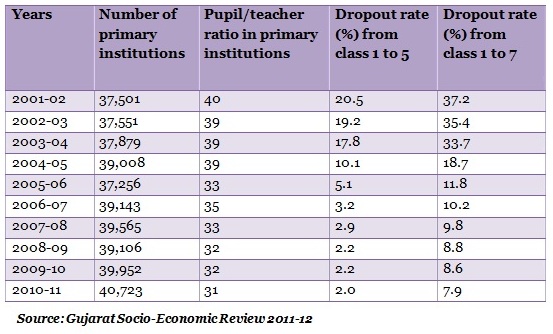
The number of primary institutions (Table 2) has gone up from 37,501 to 40,723 over 2001-11; an increase of 3,222 institutions. The pupil/teacher ratio in primary institutions has come down from 40 to 31 - a significant improvement.
Where the government has done well is in the reduction of dropout rates in primary education. Dropout rates measure the number of people dropping out of education as a percentage of those who had enrolled in primary education. The dropout rate in class 1 to 5 was 20.5 % in 2001-02. It has been brought down to 2% in 2010-11. The dropout rate in class 1 to 7 was 37.2% in 2001-02. It has been brought down to 7.9% in 2010-11.
These improvements are bound to reflect in literacy rates but the gender differential in education is what the Gujarat government has to look at in the near future.
Table 3: Health Indicators
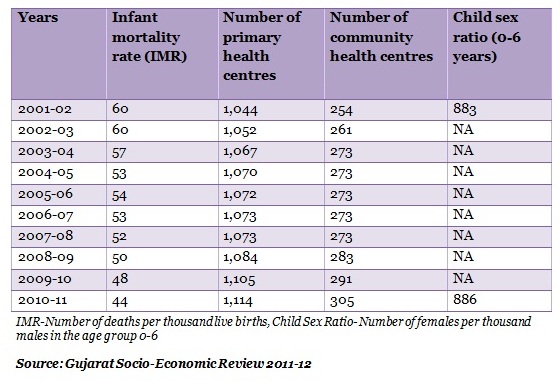
Infant mortality rate (IMR) fell from (Table 3) 60 in 2001-02 to 44 in 2010-11. Despite the improvement, Gujarat stood 25th among 35 states and union territories in 2010-11. While the female infant mortality rate stood at 51, the male infant mortality rate was 44 in 2010-11. The corresponding national figures were 49 and 46, respectively. So, the gender bias in infant deaths is quite apparent.
The number of primary health centres (PHCs) went up from 1,044 in 2001-02 to 1,114 in 2010-11; an increase of 70 centres. The number of community health centres (CHCs) went up from 254 in 2001-02 to 305 in 2010-11. The average number of villages served by primary health centres in Gujarat was 17 while the national figure was 27. The average number of villages served by community health centres in Gujarat was 64 while the national figure was 141.
The child sex ratio improved marginally from 883 females per 1,000 males in 2001 to 886 females per 1,000 males in 2011. The corresponding national figures were 927 females per 1,000 males in 2001 and 914 females per 1,000 males in 2011. Gujarat has been able to marginally close the gap but that is because the child sex ratio has deteriorated across the nation. The position of Gujarat was 31st out of 35 states and union territories in 2001. The corresponding position was 27th in 2011.
Life expectancy over 2002-06 was 62.9 years for males and 65.2 years for females in Gujarat. The corresponding national figures were 62.6 and 64.2, respectively. Over 2006-10, the life expectancy in Gujarat increased to 67.2 years for males and 71 years for females. The corresponding national figures were 65.8 and 68.1, respectively. So, Gujarat has stayed above the national level across genders in life expectancy.
So, even though the Modi government has done well with respect to industrialisation and employment, it needs to do much more when it comes to overall social improvement, especially with respect to gender bias in both health and education.
