The Worrying Increase In Disparities Within Rural India
HIGHLIGHTS
|
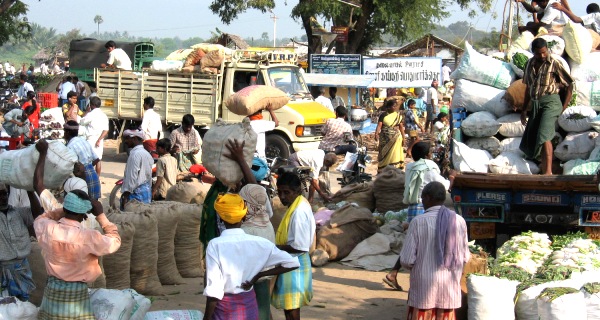
India is clearly divided in two parts: the modern and dynamic urban areas and the more rustic and agriculture-driven rural areas. With rapid economic growth, the disparity between rural ‘Bharat’ and urban ‘India’ seems to be narrowing.
That’s the good news. However, as IndiaSpend’s Prachi Salve finds out, the not-so-good news is that there is a consistent rise in the expenditure gap within rural and urban India. Which means wealth continues to get concentrated, this time in the hands of the rich folk in urban and rural India.
Table 1: Expenditure Keeps Increasing
| NSS round | Year | Rural (Rs.) | Urban (Rs.) |
| 68th* | July 2011 – June 2012 | 1,281.45 | 2,401.68 |
| 66th | July 2009 – June2010 | 927.70 | 1,785.81 |
| 61st | July 2004 – June 2005 | 558.78 | 1,052.36 |
*Figures are provisional. Source: NSSO Report
The 68thsurvey (June 2011–July 2012), conducted by the National Sample Survey Office (NSSO) for the Ministry of Statistics and Programme Implementation, shows that the monthly per capita consumer expenditure with uniform reference period (MPCEURP) is estimated to be Rs 1,281 in rural areas while it is estimated to be Rs 2,401 in urban areas. (The uniform reference period was the last 30 daysfor all items of consumer expenditure on which data was collected).
In the last six years, rural monthly expenditure has increased from Rs558.78 to Rs 1,281.45 and urban spending increased from Rs 1,052.36 to Rs2,401.68. So, rural consumption expenditure has increased by 117% as compared to the increase in urban expenditure of128%.
Focus Shifts from Food
The detailed report on consumption expenditure for the 68th NSSO survey will be available only in January 2013. Meanwhile, as per the latest NSSO survey with detailed break-up,the household expenditure on cable TV increased by 141% in rural areas while it increased only 35% in urban areas.
Table 2: Non-food items
| Miscellaneous goods and services | Rural (Expenditure Increase In %) | Urban (Expenditure Increase in %) |
| Cable TV | 141 | 35 |
| Taxis and Rickshaws | 112 | 92 |
| Petrol for vehicles | 81 | 25 |
| Telephones | 69 | 28 |
| Education | 3.6 | 8.1 |
Source: NSSO report on Consumption for the 66thNSSO round.
Interestingly, the expenditure on taxis and auto rickshaws saw an increase in rural areas by 112% and 92% in urban areas during the five-year period. And the spending on petrol for vehicles was much more in rural areas (81%) as against the increase in urban areas (25%). The per person expenditure on telephones increased 69% and 28% in rural and urban areas, respectively.
Changing Facilities
Table 3: Household Amenities and Assets
| Categories | 2001 (in %) | Difference in Rural - Urban Areas | 2011 (in %) | Difference in Rural - Urban Areas | ||
| Rural | Urban | 2001 | Rural | Urban | 2011 | |
| Households with Latrines | 21.9 | 73.7 | 51.8 | 30.7 | 81.4 | 50.7 |
| Taps with major water source | 24.3 | 68.7 | 44.5 | 30.8 | 70.6 | 44.4 |
| Banking facilities | 30.1 | 49.5 | 19.4 | 54.44 | 67.77 | 13.3 |
| Electricity as main source of light | 43.5 | 87.6 | 44.1 | 55.3 | 92.7 | 37.4 |
| Households having no major assets | 40.5 | 19.0 | -21.5 | 22 | 7 | -15.9 |
| Households with open drainage | 30.3 | 31.0 | 13.1 | 43.4 | 37.3 | 6.3 |
| Households with bathing facilities | 22.8 | 70.4 | 47.6 | 45 | 87 | 22 |
Source: Census 2011
Table 3 shows that there has been an overall reduction between the rural –urban divide. The most significant difference is in households with bathing facilities which saw the difference decline from 47.6% to 22% - a change of nearly 26%.
As per Census 2011, possession of a telephone was the highest under the household possession & assets category in rural areas with 54.3% (i.e., nearly 91 million rural households) followed by bicycle (46%) and television (33%).
Table 4: Increasing Asset Ownership
| Asset (Census 2011) | Rural (in %) | Urban (in %) |
| Telephone/mobile | 54.3 | 82 |
| Bicycle | 46.2 | 41.9 |
| Television | 33.4 | 76.7 |
Source: census 2011
For urban areas, 82% households reported having a telephone connection followed by television (77%) and bicycle (42%).
Increasing disparity
While it seems that the rural-urban divide is narrowing, disparities within the urban and rural sectors seem to be increasing. According to the 68th NSSO report, the top 10% of the rural population had an average expenditure of Rs 3,459.77, about 6.9 times that of the bottom 10%. The top 10% of the urban population had an average expenditure of Rs 7,651.68, about 10.9 times that of the bottom 10%.
Table 5: Divide Continues
| Decile Class limit | Rural | Urban | ||
| 66th NSSO round | 68th NSSO Round | 66th NSSO round | 68th NSSO Round | |
| 10% Lower limit | 452.98 | 503.49 | 599.27 | 702.26 |
| 10% upper limit | 2516.69 | 3459.77 | 5863.25 | 7651.68 |
Source: NSSO reports (MOSPI)
It can be seen from Table 5 that the rural poor’s expenditure increased 10.5% while the expenditure of the rural rich went up 31.5%. At the same time, in urban areas, the expenditure of the poor increased by 15.8% while the rich experienced a growth of 29.1%. So, the gap within the rural poor and rich and urban poor and rich is increasing, which could be a cause of concern for the government pushing for ‘inclusive development’.
