India’s G20 Standing: Don’t Let The Economic Growth Numbers Fool You
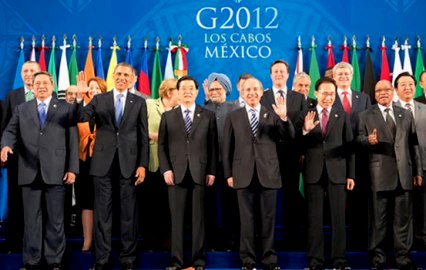 There was some consternation over India’s recent $10 billion pledge to the International Monetary Fund (IMF) reserve. This amount would contribute towards an additional $450 billion firewall to resolve the Euro zone crisis. The pledge was made in June 2012 at the G20 Summit in Los Cabos, Mexico.
IndiaSpend’s Sourjya Bhowmick takes a cue from the G20 Summit to see how India stands across both economic and social parameters against other member nations of the G20. The somewhat straight conclusion is; India scores well against G20 countries when it comes to economic growth, but fares badly on social development.
Incidentally, Russia, Indian, Brazil donated $10 billion each while China provided $43 billion. This $450 billion fund will be used to provide relief to the PIGS (Portugal, Ireland, Greece, and Spain) economies.
Before we go any further, here is the total list of all the member nations and some statistics;
*G 20 members represent almost 90% of global GDP
*G20 members represent about 80% of the international global trade.
*Approximately 84% of all fossil fuel emissions are produced by G20 countries.
*The G20 countries account for about 64% of the world’s population
*By the end of 2009 the G 20 had created 7 to 11 million jobs.
Growth Rate vs HDI Rankings
Let’s look at GDP, growth rate and Human Development ranks of these countries;
Table 1: G20 Stats
| Country | GDP 2011 (PPP) | GDP 2011 (Nominal) | Growth Rate 2011 (in percent) | Growth Rate 2010 | Per Capita Income 2010 (US$) |
| United States of America | 15.0 | 15.0 | 1.5 | 3 | 43,017 |
| China | 11.3 | 7.2 | 9.2 | 10.5 | 4,382 |
| India | 4.4 | 1.6 | 7.8 | 10.1 | 1,371 |
| Japan | 4.3 | 5.8 | -0.5 | 4 | 42,783 |
| Germany | 3.0 | 3.5 | 2.7 | 3.6 | 40,274 |
| Russia | 2.3 | 1.8 | 4.3 | 4.3 | 10,356 |
| Brazil | 2.3 | 2.4 | 2.7 | 7.5 | 10,816 |
| United Kingdom | 2.2 | 2.4 | 1.1 | 1.4 | 36,164 |
| France | 2.2 | 2.7 | 1.7 | 1.4 | 40,704 |
| Italy | 1.8 | 2.1 | 0.4 | 1.3 | 34,059 |
| Mexico | 1.6 | 1.1 | 3.8 | 5.4 | 9,522 |
| Republic of Korea | 1.5 | 1.1 | 3.6 | 6.2 | 28,230 |
| Canada | 1.3 | 1.7 | 2.2 | 3.1 | 46,303 |
| Indonesia | 1.1 | 0.8 | 6.4 | 6.1 | 2,974 |
| Turkey | 1.1 | 0.7 | 4.6 | 8.2 | 10,309 |
| Australia | 0.9 | 1.4 | 1.8 | 2.7 | 55,672 |
| Argentina | 0.7 | 0.4 | 8 | 9.2 | 9,131 |
| Saudi Arab | 0.6 | 0.5 | 6.5 | 4.1 | 16,267 |
| South Africa | 0.5 | 0.4 | 3.4 | 2.8 | 7,274 |
(All figures in trillion $)
Source: World Human Development Report, 2011
(The table is organised based on higher to lower GDP, PPP)
The European Union (which is a part of the G20) has been left out of this table as they are a conglomerate of many nations. The table has been organised on the basis of a ranking of the countries with highest GDP as on 2011.
The table shows that growth rates of almost all countries decreased gradually. Saudi Arabia, South Africa, Indonesia, Canada, France are the only countries where growth rose. Russia interestingly had the same growth rate. Turkey, Brazil and Japan saw a major drop.
On the other hand, India and China, both with impressive GDPs and growth rates look weak when it comes to human development rankings.
India’s GDP growth rate currently stands at 5.3%, the lowest since 2003 when it dipped to 3.6% in January-March quarter of 2003. The ongoing Euro crisis has resulted in poor growth rates among the G20 nations.
India’s Dismal HDI Rankings
While India seems to be better off when it comes to growth figures, the Human Development Ranking is the worst among the G20 countries. Here’s a look at the international HDI rankings.
Table 2: International HDI Rankings
| Country | HDI Rank (2011) |
| United States of America | 4 |
| China | 101 |
| India | 134 |
| Japan | 12 |
| Germany | 9 |
| Russia | 66 |
| Brazil | 84 |
| United Kingdom | 28 |
| France | 20 |
| Italy | 24 |
| Mexico | 57 |
| Republic of Korea | 15 |
| Canada | 6 |
| Indonesia | 124 |
| Turkey | 92 |
| Australia | 2 |
| Argentina | 45 |
| Saudi Arab | 56 |
| South Africa | 123 |
International Health Indicators
Let’s take a look at a few social indicators and see how India does as compared to the other G 20 nations. First up, a few health indicators:
Table 3: G20 Health Indicators
| Countries | Life Expectancy at birth | Maternal Mortality ratio | Infant Mortality Rate | Health Expenditure as % of GDP |
| USA | 78.5 | 24 | 5.98 | 16.2 |
| China | 73.5 | 38 | 15.62 | 4.6 |
| India | 65.4 | 224 | 46.07 | 1.2 |
| Japan | 83.4 | 6 | 2.21 | 9.3 |
| Germany | 80.4 | 7 | 3.51 | 8.1 |
| Russia | 68.8 | 39 | 9.88 | 5.4 |
| Brazil | 73.5 | 58 | 20.5 | 9 |
| UK | 80.2 | 12 | 4.56 | 9.3 |
| France | 81.5 | 8 | 3.37 | 3.5 |
| Italy | 81.9 | 5 | 3.36 | 5.1 |
| Mexico | 77 | 85 | 16.77 | 13.8 |
| Republic of Korea | 79.3 | 18 | 4.08 | 6.5 |
| Canada | 81 | 12 | 4.85 | 10.9 |
| Indonesia | 71.62 | 240 | 26.99 | 5.5 |
| Turkey | 74 | 23 | 23.07 | 6.7 |
| Australia | 81.9 | 8 | 4.55 | 8.5 |
| Argentina | 75.9 | 70 | 10.52 | 9.5 |
| Saudi Arab | 73.9 | 24 | 15.61 | 5 |
| South Africa | 52.8 | 410 | 42.67 | 8.5 |
Source: World Human Development Report, 2011
As you can see from the above table, India is one of the worst performers among the G20 countries in terms of health indicators. When it comes to life expectancy, India stands second last, with only South Africa doing worse than us.
India has the 3rd worst Maternal Mortality Ratio and the highest Infant Mortality Ratio. And India is also the worst when it comes to healthcare expenditure, spending only about 1.2% of the GDP on Healthcare.
G20: Education Scenario
Now let’s take a look at education across G20 nations.
Table 4: G20 Education Indicators
| Countries | Expected years of schooling | Mean years of schooling | Population with at least secondary education | Education expenditure as% of GDP | ||
| Female | Male | |||||
| USA | 16 | 12.4 | 95.3 | 94.5 | 5.5 | |
| China | 11.6 | 7.5 | 54.8 | 70.4 | NA | |
| India | 10.3 | 4.4 | 26.6 | 50.4 | 3.1 | |
| Japan | 15.1 | 11.6 | 80 | 82.3 | 3.5 | |
| Germany | 15.9 | 12.2 | 91.3 | 92.8 | 4.5 | |
| Russia | 14.1 | 9.8 | 90.6 | 95.6 | 3.9 | |
| Brazil | 13.8 | 7.2 | 48.8 | 46.3 | 5 | |
| UK | 16.1 | 9.3 | 68.8 | 67.8 | 5.5 | |
| France | 16.1 | 10.6 | 79.6 | 84.6 | 5.6 | |
| Italy | 16.3 | 10.1 | 67.8 | 78.9 | 4.3 | |
| Mexico | 13.9 | 8.5 | 55.8 | 61.9 | 4.8 | |
| Republic of Korea | 16.9 | 11.6 | 79.4 | 91.7 | 4.2 | |
| Canada | 16 | 12.1 | 92.3 | 92.7 | 4.9 | |
| Indonesia | 13.2 | 5.8 | 24.2 | 31.3 | 2.8 | |
| Turkey | 11.8 | 6.5 | 27.1 | 46.7 | 2.9 | |
| Australia | 18 | 12 | 95.1 | 97.2 | 4.5 | |
| Argentina | 15.8 | 9.3 | 57 | 54.9 | 4.9 | |
| Saudi Arab | 13.7 | 7.8 | 50.3 | 57.9 | 5.6 | |
| South Africa | 13.1 | 8.5 | 66.3 | 68 | 5.4 | |
Source: World Human Development Report,2011
The table shows that India has the lowest expected years of schooling and the lowest mean years of schooling. And India has the 3rd lowest expenditure on education, spending only about 3.1% of GDP on education.
Only about 26% of the female population receives at least secondary education, while about 50% of the male population in the country has received secondary education.
The only country in the G20 that is worse than India in terms of educated women is Indonesia where only about 24% of the women have received their secondary education. When it comes to males who have received secondary education, there are only two countries that fall behind India; Brazil and Turkey.
All this of course is not an answer to the question as to whether India should have contributed $10 billion to the IMF or not. It does give you a sense on the distance covered and the massive challenges ahead, particularly as you look beyond the numbers, at the people.